Jyoti Prakash

I'm an urban planning graduate with a background in landscape architecture. I've always been drawn to how places are shaped and the decisions that influence the way we live in them. For me, planning is about understanding how those decisions are made and what they mean for the places and communities they affect. My studies have led me to explore New Zealand's planning legislation and the way it shapes urban development. I've also spent much of my academic work looking at flooding and how cities can better prepare for environmental risks, first through landscape research and later through urban planning and spatial analysis. Coming from a design background, I enjoy looking at the built environment from both a planning and design perspective. I'm keen to bring these perspectives into professional practice, continue learning from those around me and contribute to work that makes a difference to the places people call home.
From shaping landscapes through design to understanding the planning decisions that shape our cities.
 Master of Urban Planning (Professional)University of Auckland · 2025 — 2026
 Bachelor of Landscape Architecture (Honours)Unitec Institute of Technology · 2021 — 2024
Drawn to the decisions behind our cities, from the planning rules on paper to the places they shape on the ground.
Planning & Policy
- Urban Planning
- NZ Planning Legislation
- Resource Management
- Environmental Planning
Research & Spatial Analysis
- GIS & Spatial Analysis
- Flood Risk Research
- Geospatial Mapping
- Evidence-based Research
Landscape & Design
- Landscape Architecture
- Landscape Design
- Urban Design
- Visual Communication
Software & Technical Skills
- ArcGIS Online
- AutoCAD
- Revit
- Adobe Illustrator
- Adobe Fresco
- Word, Excel & PowerPoint
in Auckland's walkable catchments
Growth goes to places that are easy to reach, but accessibility says little about how well those places can absorb it. This research builds a Flood Readiness Index in ArcGIS Pro to compare the 66 walkable catchments in Auckland's proposed Plan Change 120. The results show that a shared accessibility rationale does not mean shared readiness: catchments chosen for the same reason differ sharply, and their averages hide variation inside them.
Seventeen indicators sit in three dimensions. Each is standardised, combined into a subindex and ranked, then the three are joined with a geometric mean, so one severe weakness holds the whole score down.
Flood Prone · Flood Sensitive · Coastal Inundation · Overland Flow · Impervious Surface · Slope
Stormwater Pipes · Stormwater Points · Flood-free Roads · Fire Station · Hospitals · Schools · Convenience Stores · Supermarkets · Parks · Places of Worship
Population
- 1Min-max standardisationPositive and negative indicators are classified, and negative indicators are inverted.
- 2Subindex aggregationEach subindex is the sum of its contributing indicators divided by the total number of indicators.
- 3Percentile rankPuts the subindices on a common, outlier-robust scale.
- 4Geometric meanFRI = ∛(Safety × Capacity × Exposure), equally weighted at 0.33 each. A severe weakness in any one dimension constrains the result.
- 5Flood Readiness IndexOne score per SA1 area, showing its relative position among the units analysed.
Each region is mapped at SA1 level, with a Flood Readiness Index score for every area inside the walkable catchments.
- Walkable Catchment
- SA1 Area
- Lowest Readiness
- Low Readiness
- Moderate Readiness
- High Readiness
- Highest Readiness
- Open Space
Central Auckland
Waitematā, Te Waihorotiu, Karanga-a-Hape, Maungawhau, Grafton, Parnell, Kingsland, Morningside, Baldwin Avenue, Mt Albert, Newmarket, Remuera, Greenlane, Ōrākei, Meadowbank, Ellerslie and Penrose.
- Basemap
- Esri / ArcGIS Pro
The waterfront shows weaker readiness under the model, driven by mapped coastal inundation, flat reclaimed land and dense population.
Click a map to enlarge it.
Under the specified model, the results are consistent with three of the thesis's propositions.
- P1
A shared rationale does not mean shared readiness
Catchments designated for the same accessibility reasons differ widely. Polygon averages run from 0.255 at Sylvia Park to 0.696 at Albany.
- P2
Readiness is spatially structured
FRI scores show statistically significant spatial clustering, so similar levels of readiness sit close together.
- P3
Averages hide variation inside a catchment
At least one polygon holds internal variation close to that of the entire study area.
- the window
Comparison is still possible before capacity is enabled
Council decisions on Plan Change 120 are expected in mid-2027. Until then, a comparative readiness assessment can still inform where capacity sits.
The findings do not show that Plan Change 120's designations are inappropriate. The index has not yet been validated against observed flooding, and its sensitivity tests are still to be run.
Ask me anything about this project.
a transit-oriented waterfront structure plan and design guidelines
The Port of Auckland sits between operational intensification and urban transformation. This studio project reads the site's history, planning context and conditions, then proposes a transit-oriented waterfront precinct: a structure plan and urban design guidelines built from walkability, flood and transit logic, for a place that is more public, more green and better connected.
National direction protects the Port as nationally significant infrastructure, while also pushing intensification and ecological restoration. Local strategies organise around three themes.
- Nature & Ecology
Restore the harbour
The Auckland Climate Plan, Water Strategy and Waterfront Vision 2040 promote a blue-green vision and the restoration of te Mauri o te Wai, in partnership with Ngāti Whātua Ōrākei.
- Urbanisation
Absorb residential growth
The Auckland Plan 2050 identifies the site for urban expansion, and the Port Precinct Framework Plan proposes phased development of 85 ha as a mixed-use precinct.
- Publicisation
Open the waterfront
The Framework Plan sets aside 25% of the 85 ha for public purposes, with key wharves released by 2039.
All of this sits against the Port's protected status as nationally significant infrastructure, and coastal hazard policy that requires a 100-year planning horizon.
Five readings of the site as it stands: landform, ownership, transport, flood and access.
- Contours every 2.5 m
- Low ground (−4.6 m)
- High ground (88.8 m)
A flat, engineered shoreline
A sharp transition from the Parnell and Grafton ridges to flat, engineered land marks the historic shoreline. V-shaped contours along Stanley Street and the downtown precinct reveal paleo-channels that once flowed into the harbour.
Click a map to enlarge it.
The structure plan repositions the Port as a transit-oriented waterfront development, where proximity to transport and surrounding urban anchors shapes land use and character.
Higher density within 800 m · Land-use diversity · Pedestrian-friendly design · Destination accessibility · Distance to transit
Safety from traffic · Maximum lot sizes of 150 × 110 m · Alleys and paths through large blocks · Active building frontage
Large continuous patches over fragmented greenery · Green corridors that connect open spaces · Playgrounds every 100 m, greenery every 500 m
- 1Grid the siteA 150 × 110 m grid sets the maximum block size and keeps walkability central.
- 2Overlay the waterFlood plains and flood-prone areas are laid over the grid, and paleo-channels show where water already flows.
- 3Green the intersectionsWhere the grid meets flood-prone land, intersections become green space and corridors.
- 4Tier the intensityOverlapping train and bus catchments set five tiers of density.
- 5The structure planZoning for built zones, a green and open space framework, and a Māori Purpose Zone.
Each step is a map: the grid, the flood land, the water paths, the green framework, then the transit catchments.
- 150 × 110 m block grid
A walkable grid
A 150 × 110 m grid defines the grain of the site and the maximum block size, with pedestrian circulation framed against the existing conditions.
Click a map to enlarge it.
The result: a transit-oriented precinct with its densest zones beside the dual transport links, and green edges along the water.
- Metropolitan Centre
- Town Centre
- Business Park
- Mixed Use
- Local Centre
- Neighbourhood Centre
- Informal Recreation
- Community
- Sport and Active Recreation
- Civic Spaces
- Mixed Housing Urban
- Māori Purpose
- Pedestrian-only pathways
Proposed zoning
Built zones step down from the proposed station and Quay Street, with a green and open space framework around the edges and through the flood land.
Click a map to enlarge it.
- Metropolitan Centre
Intensity follows transit
Areas closest to the dual public transport links are zoned Metropolitan Centre, supporting the highest-intensity mix of commercial, residential and civic uses. The Town Centre Zone around them steps down slightly within the 5-minute train catchment.
- Jellicoe & Freyberg
Waterfront edges turn green
The waterfront edges become green space to preserve views, strengthen ecological systems and support public access. Neighbouring areas are down-zoned to Neighbourhood Centre and Mixed Use, for a people-oriented edge.
- Bledisloe & Fergusson
Context beyond transit
Where public transport does not reach, zoning follows context. Bledisloe, beside the CBD and Wynyard Quarter, takes employment-led uses, and Fergusson, aligned with the eastern suburbs, is Mixed Housing Urban.
- Māori Purpose
A place for Te Toka O Apihai Te Kawau
The south-western end is a Māori Purpose Zone, recognising the significance of Te Toka O Apihai Te Kawau and enabling cultural development and expression.
The structure plan set the armature. This half of the project works at the scale of a person walking through it.
- Part two
One project, two scales
Part one decided where things go. Part two decides what it is like to be there.
- The name
The long drag, reversed
Te Tōangaroa remembers waka hauled ashore at low tide. The reclamation cut that link. The guidelines draw it back, from the station down to the water.
- The test
Five goals
A blue-green network, a connected site, a public place, a seven-day economy, and a culture that stays visible. Every chapter that follows is held against them.
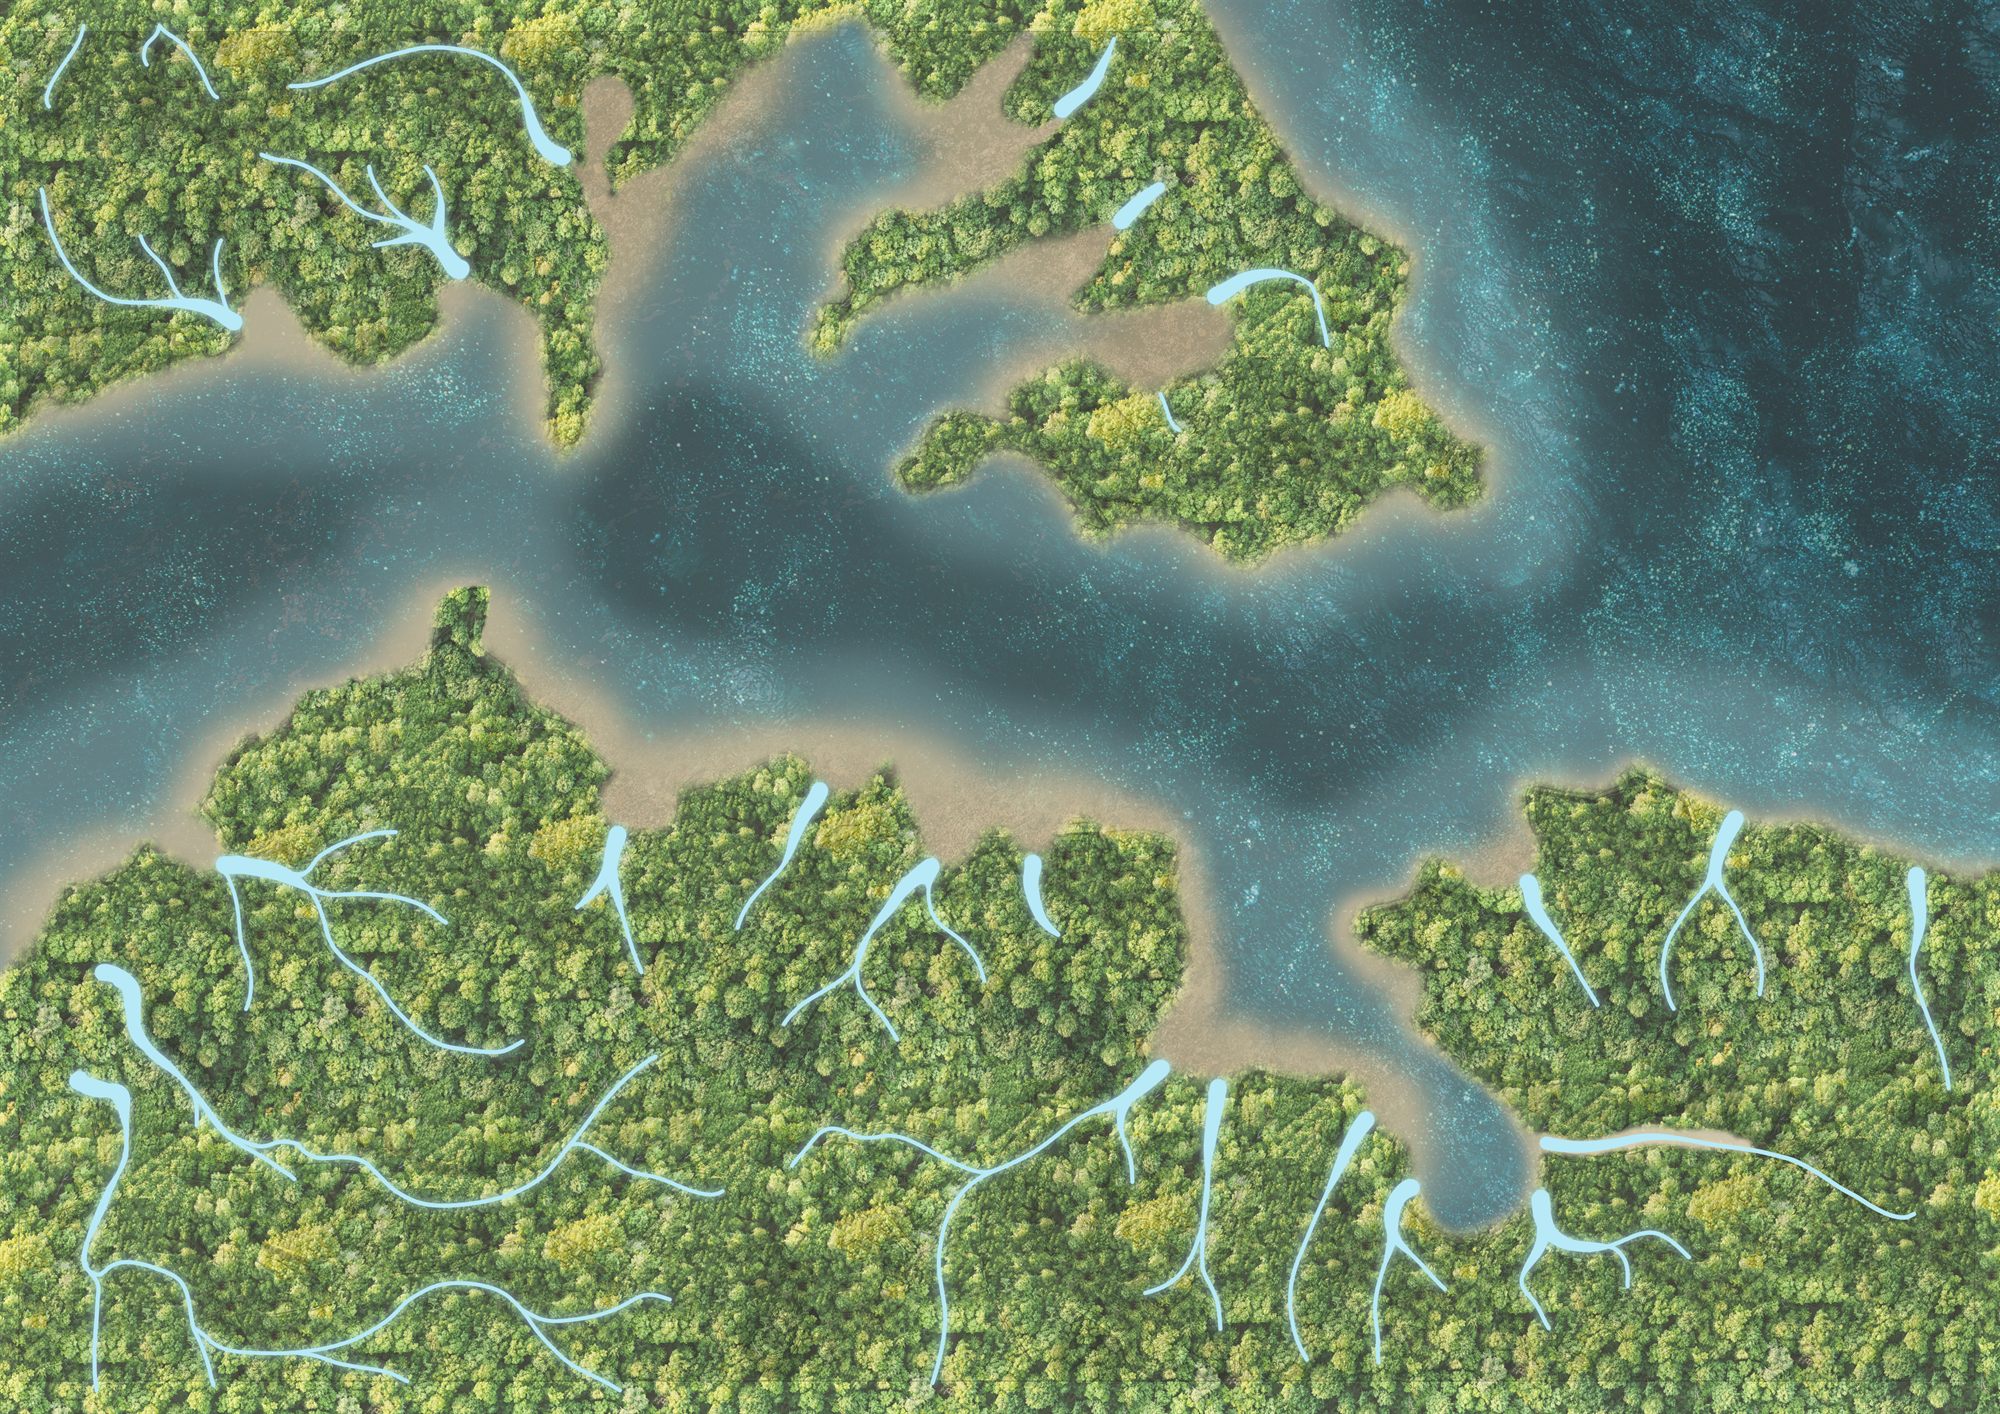
Two streams ran through this site before the reclamation. They fed the harbour and a fishing village at Waipapa, and the flat land between them was a landing place for waka. Reclamation buried both. Their line is still under the concrete, and in heavy weather the water finds it again.
the ground remembers
Nine readings of one site. Each one turns a condition of the land, or of policy, into an intention for the design.
The shoreline is still legible.
Reclamation flattened the ground and left the old shoreline written in the contours. Fencing keeps people out, so the edge gets seen and never entered.
open the edge
Hover a circle to read it. Click to enlarge.
The precinct
Two transit hubs, a green network and a new public realm, drawn as one system. The station is the first page of the cultural spine. City Rail Link worked with iwi so the facade could carry local narratives, which gives Ngāti Whātua Ōrākei room to shape the arrival on their own terms.
the whole thing at once
The public realm in close up
From above the route reads clearly. Waka at the forecourt, then the market, then the green edge and the harbour. The market is built from containers, low-barrier space for local Māori enterprise and a place for community events at the city's front door.
station to sea
Standing in it
From the forecourt looking north. Waka on their plinths, the market beyond, the green edge, then the Waitematā. The heights step away to keep the sky open.
the long drag, reversed
The green edge
Ponds, native planting and a timber pavilion, built where the water already wanted to go. The play space is made of timber, stone and topography, so tamariki learn the place by climbing through it. The māra kai sits at the centre, the part of the plan people tend. Final decisions on form, material and configuration sit with Ngāti Whātua Ōrākei, through co-design and co-governance.
who holds the pen
Density steps down from the station, and the plaza measures itself against the buildings that frame it.
Fifty metres, then thirty-two and a half
The tallest building sits on Te Tōangaroa Station, where every arrival becomes footfall. The form steps down to 32.5 m at the Quay Park bus hub and holds to the water. That step keeps light on the plaza and holds the view open to the Waitematā.
density as a promise
Fifty metres, in seven parts
Four metres of transition at each building face, then four of movement, three of activity, twenty-eight of movement, three of activity, four of movement, four of transition. The generous centre lets a walker pass someone standing still without breaking stride.
every metre is doing a job
A room this wide only works if its edges are furnished.
- Active frontage
The edge is the room's furniture
Cafés and restaurants spill into the transitional zone. That is how frontages stay alive in Lille and in most cities that get it right. The northern end is encouraged to do the same and borrow life from the green space.
- Laneways
Pockets of life
Laneways link the plaza to the streets and the bus stops. Gehl saw them as more than routes. Shops and cafés give people a reason to slow down.
- Seven-day economy
Busy on Tuesday, alive on Sunday
Weekdays belong to movement. Weekends need a reason to stay, and the market, the containers and the cultural programme supply it.
- Walking
The lifeblood of transit
Walking links the station to everything around it. Splitting the plaza edge into zones lets different speeds share the same room.
Ask me anything about this project.
rethinking Eden Park as a living water basin
Eden Park sits at the bottom of a natural bowl. When heavy rain hits Kingsland and Sandringham, runoff from the surrounding ridges follows gravity straight toward the stadium and Morningside. McHarg-style suitability mapping traces where water naturally wants to go across the catchment, setting up two masterplanning paths over the next century. One carves a continuous green spine through the valley floor. The other tucks clustered wetlands into the existing suburb.
Four readings of the terrain and planning rules around Eden Park show how topography and current zoning push water into the middle of the suburb. Below them, the McHarg overlay stacks flood plains, flood-prone zones and overland flow paths in translucent red to reveal where compound risk deepens.
Ridges around a natural bowl.
Sandringham Road, Walters Road and Reimers Avenue sit on ridges. The ground falls evenly from the high northern and eastern terraces down to Eden Park and the outer oval, turning the middle of the site into a collection basin that drains toward Morningside.
- High ground (58.6 m)
- Upper terraces
- Mid slopes
- Low basin (32.6 m)
water flows to the oval
Hover a circle to read it. Click to enlarge.
- Single flood layer
- Two overlapping layers
- Compound risk (three layers)
Flood plains, flood-prone areas and overland flow paths are drawn in the same translucent red. Where two or three layers overlap, the crimson deepens across Eden Park, the outer oval and the gullies feeding down from the north and southeast. Every masterplanning move that follows is anchored to this map.
darker red means deeper overlap
Click the map to enlarge it.
Once the vulnerable ground is mapped, two masterplanning tracks test how much of the existing suburb should give way to water. Switch through the tabs below to compare the Radical Spine against the Conservative Clusters.
Both concepts keep Eden Park as the main flood basin and keep the western commercial edge consistent with Morningside, while testing two very different approaches to housing and open space.
One continuous green spine
The land between the grey boundary lines is renaturalised into an unbroken green corridor for water storage and purification. To replace houses lost to the spine and open view shafts to the park, adjacent blocks step up to apartments, surrounded by terraced housing and mixed-use strips along the arterial roads.
clear the valley floor, build along the edge
Broken into protective pockets
As many existing homes as possible stay intact. Instead of one continuous corridor, the spine breaks into separate green clusters over the most flood-prone pockets. Apartments focus along Sandringham Road in line with the Unitary Plan, while terraced houses frame the new green reserves.
protect existing homes, pocket the water
- Wetland & pond basins
- Detention & reserve clusters
- Apartment zone
- Terraced housing
- Preserved single houses
- Mixed use & commercial
- Education zone
Three sketches tested how the retention pond, the terraced seating and the social spaces should sit between the practice pitches and Sandringham Road before the final oval was chosen.
1. Split pond and fluctuation slope
The first concept turned the western practice pitches into a pond with an exaggerated grey slope in the middle to show water level changes, while keeping social spaces on the main pitch. Because the slope could not be used when wet and the northern seating faced the incoming stream rather than the pond, too much space was lost.
seating faced away from the pond
2. Removing the slope
The second sketch removed the middle slope and rotated the purple terraced seating to face the pond on the practice pitches. However, the orange social zone remained tucked in the east away from the busy footfall of Sandringham Road, and separating the two low basins held back the pond's storage capacity.
social spaces sat too far from the street
3. One oval, street to terrace
The chosen concept combines the practice pitches and the Eden Park field into one primary retention pond. The orange social edge shifts to the western rim along Sandringham Road to draw people in from the main street, while the purple terraced seating anchors the eastern curve facing back across the water.
chosen for site development
- Retention pond & stream
- Social spaces
- Terraced seating
- Exaggerated fluctuation slope
- Regenerative edge planting
The final retention pond spans roughly 250 metres in length and 150 metres in width, holding around 137,130 cubic metres of water. Its elliptical shape honours the rugby and cricket pitches that defined Eden Park for a century, while wavy volcanic boulders trace the lava flows of Three Kings, Mount Eden and Mount Albert across the basin floor.
The historic sporting oval
Rugby and cricket are both played on elliptical grounds. Before modern stands enclosed the stadium, the open oval turf and practice fields sat clearly inside the low volcanic basin of Mount Eden.
the shape of the game
- Play area
- Meadow area
- Zen garden
- Community garden
- Terraced seating
A 250 × 150 metre wetland basin
Social spaces line the western edge along Sandringham Road to welcome daily foot traffic, while the eastern terraced seating looks back across the volcanic rock waves and native turf-like wetland planting.
137,130 cu m retention volume
West to east across the oval
Cutting from Sandringham Road on the west through the forest edge planting, volcanic rocks and native retention pond planting to the terraced seating on the eastern rim.
Sandringham Road to the eastern terraces
South to north across the valley
Cutting from Reimers Avenue on the south across the forest edge, basalt rock waves and retention pond up to the proposed apartment housing and Walters Road on the northern ridge.
Reimers Avenue to Walters Road
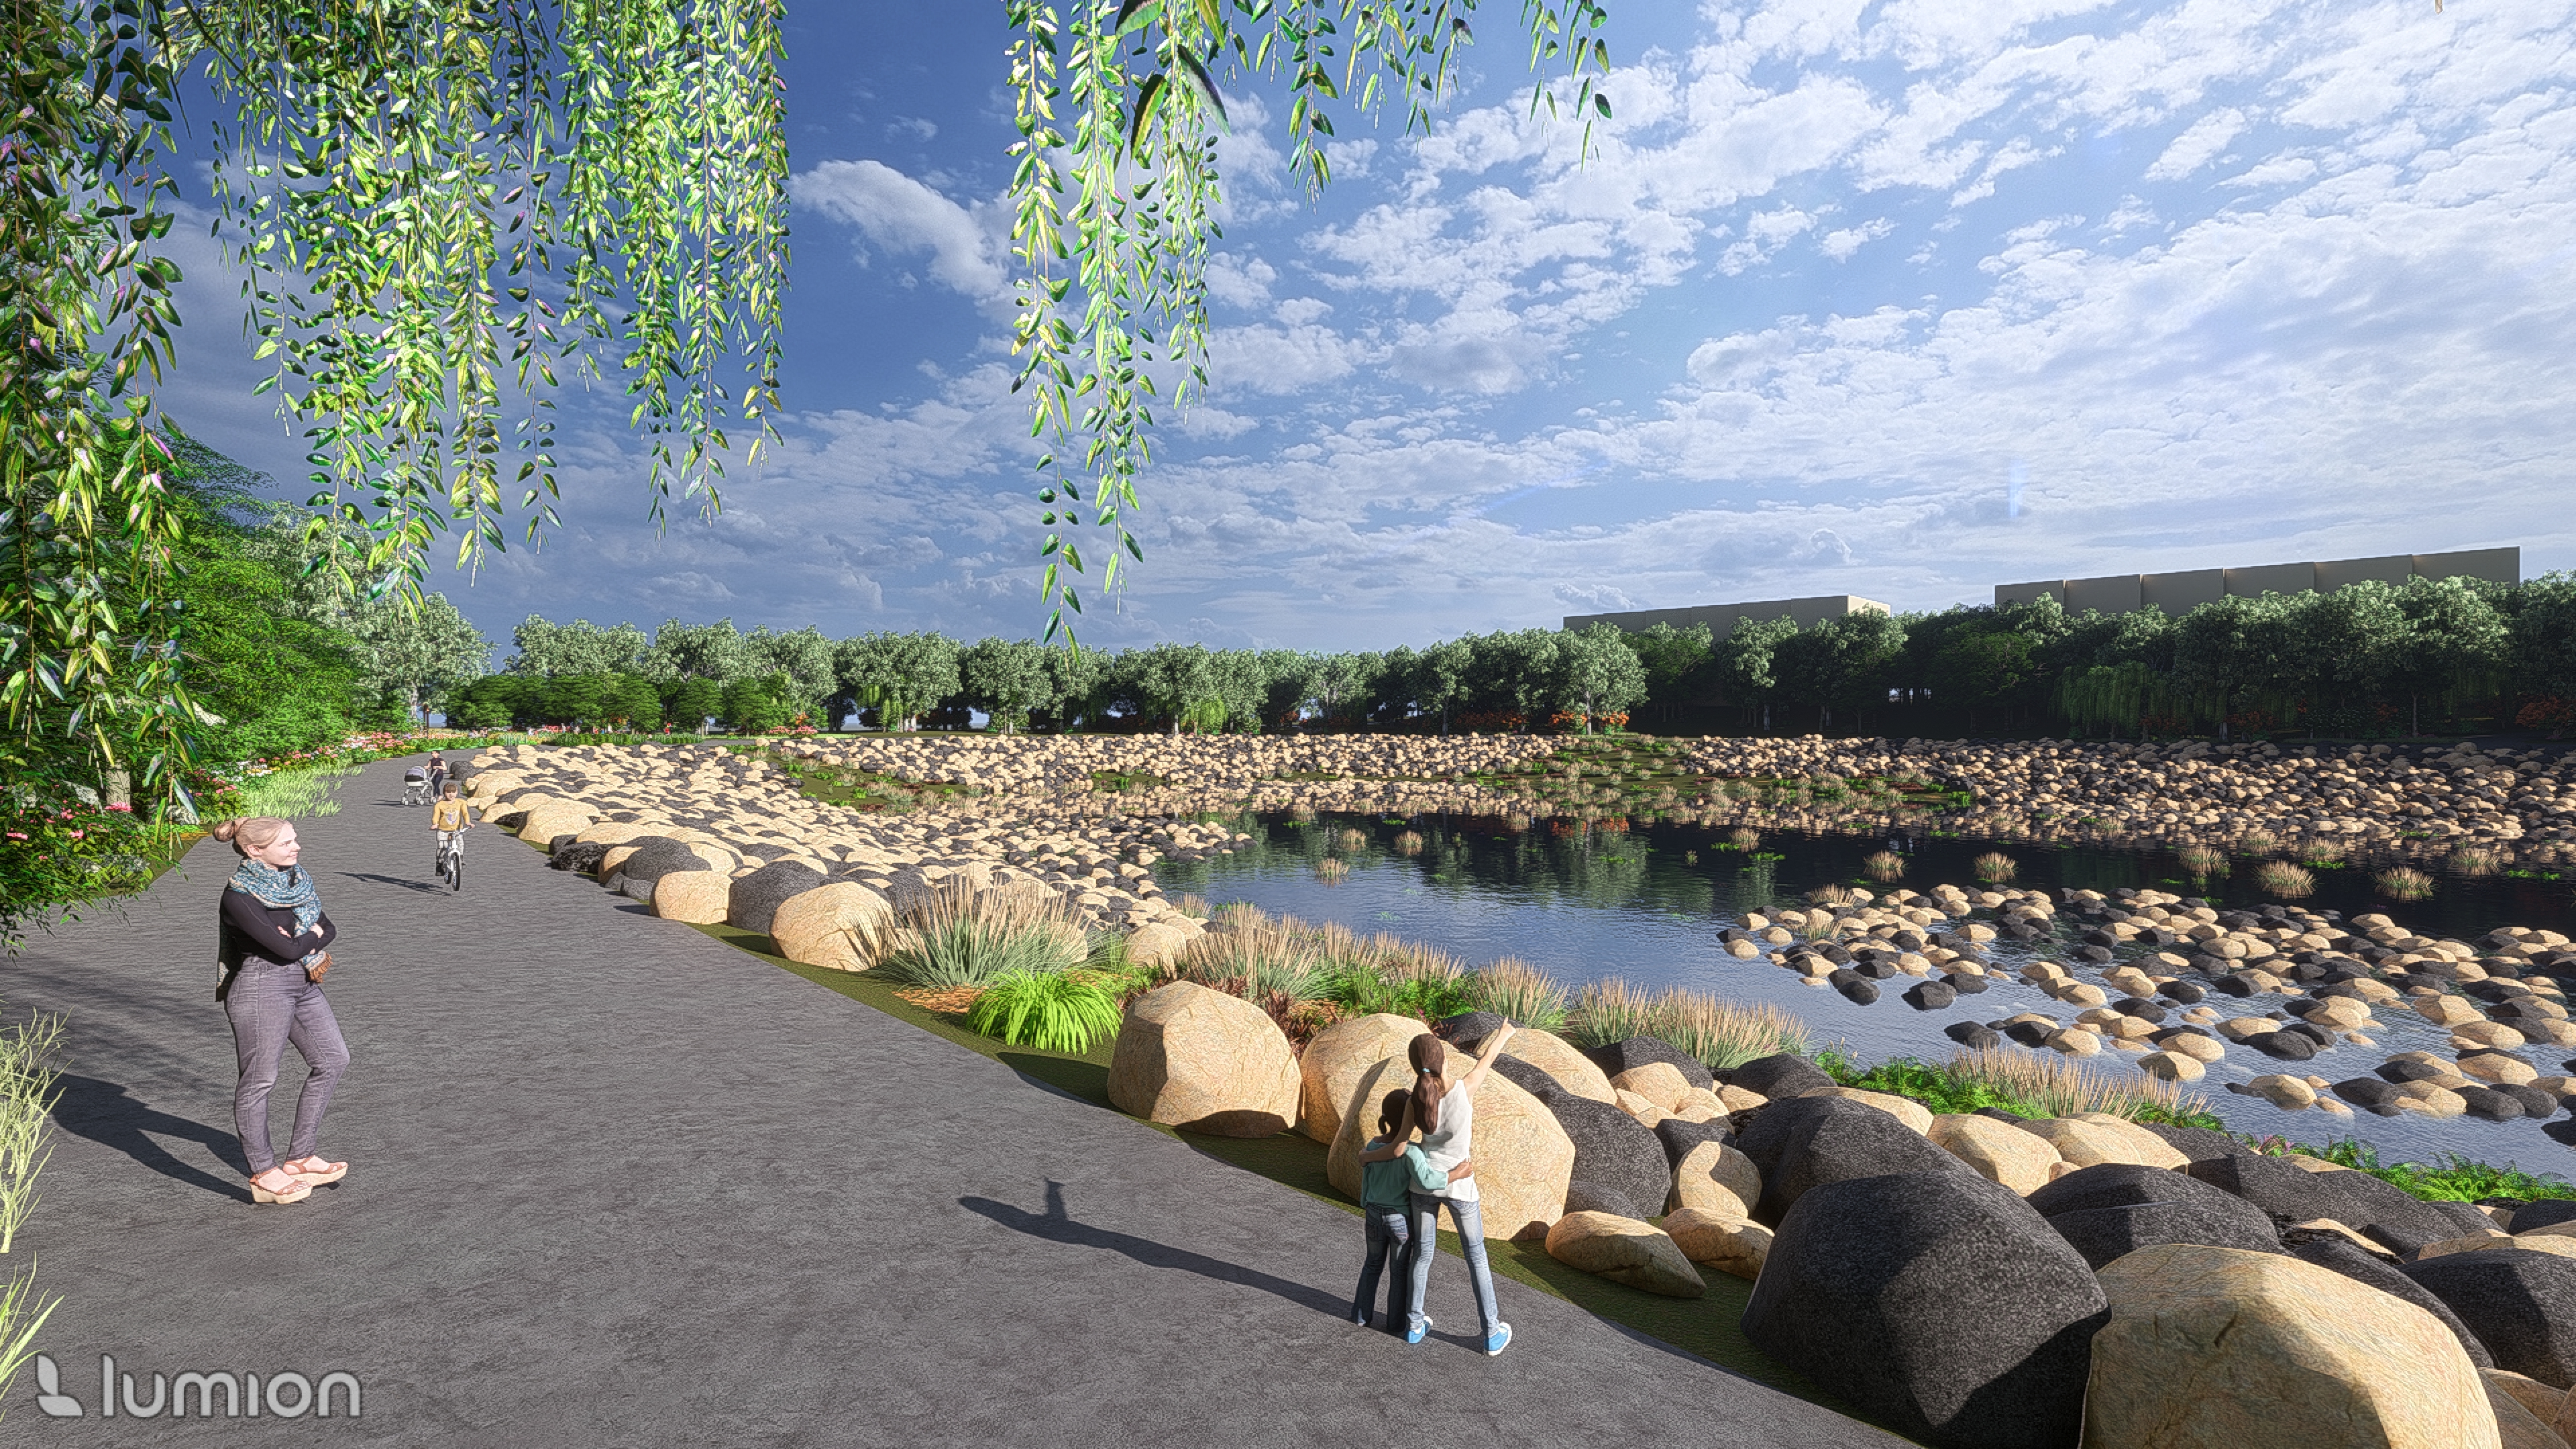
Wavy basalt boulders run through the shallow water to recall the ancient lava flows of Three Kings, Mount Eden and Mount Albert. Native grass-like wetland plants thrive across changing water levels while echoing the lawn and turf of the old cricket and rugby fields.
volcanic grit and sporting memory
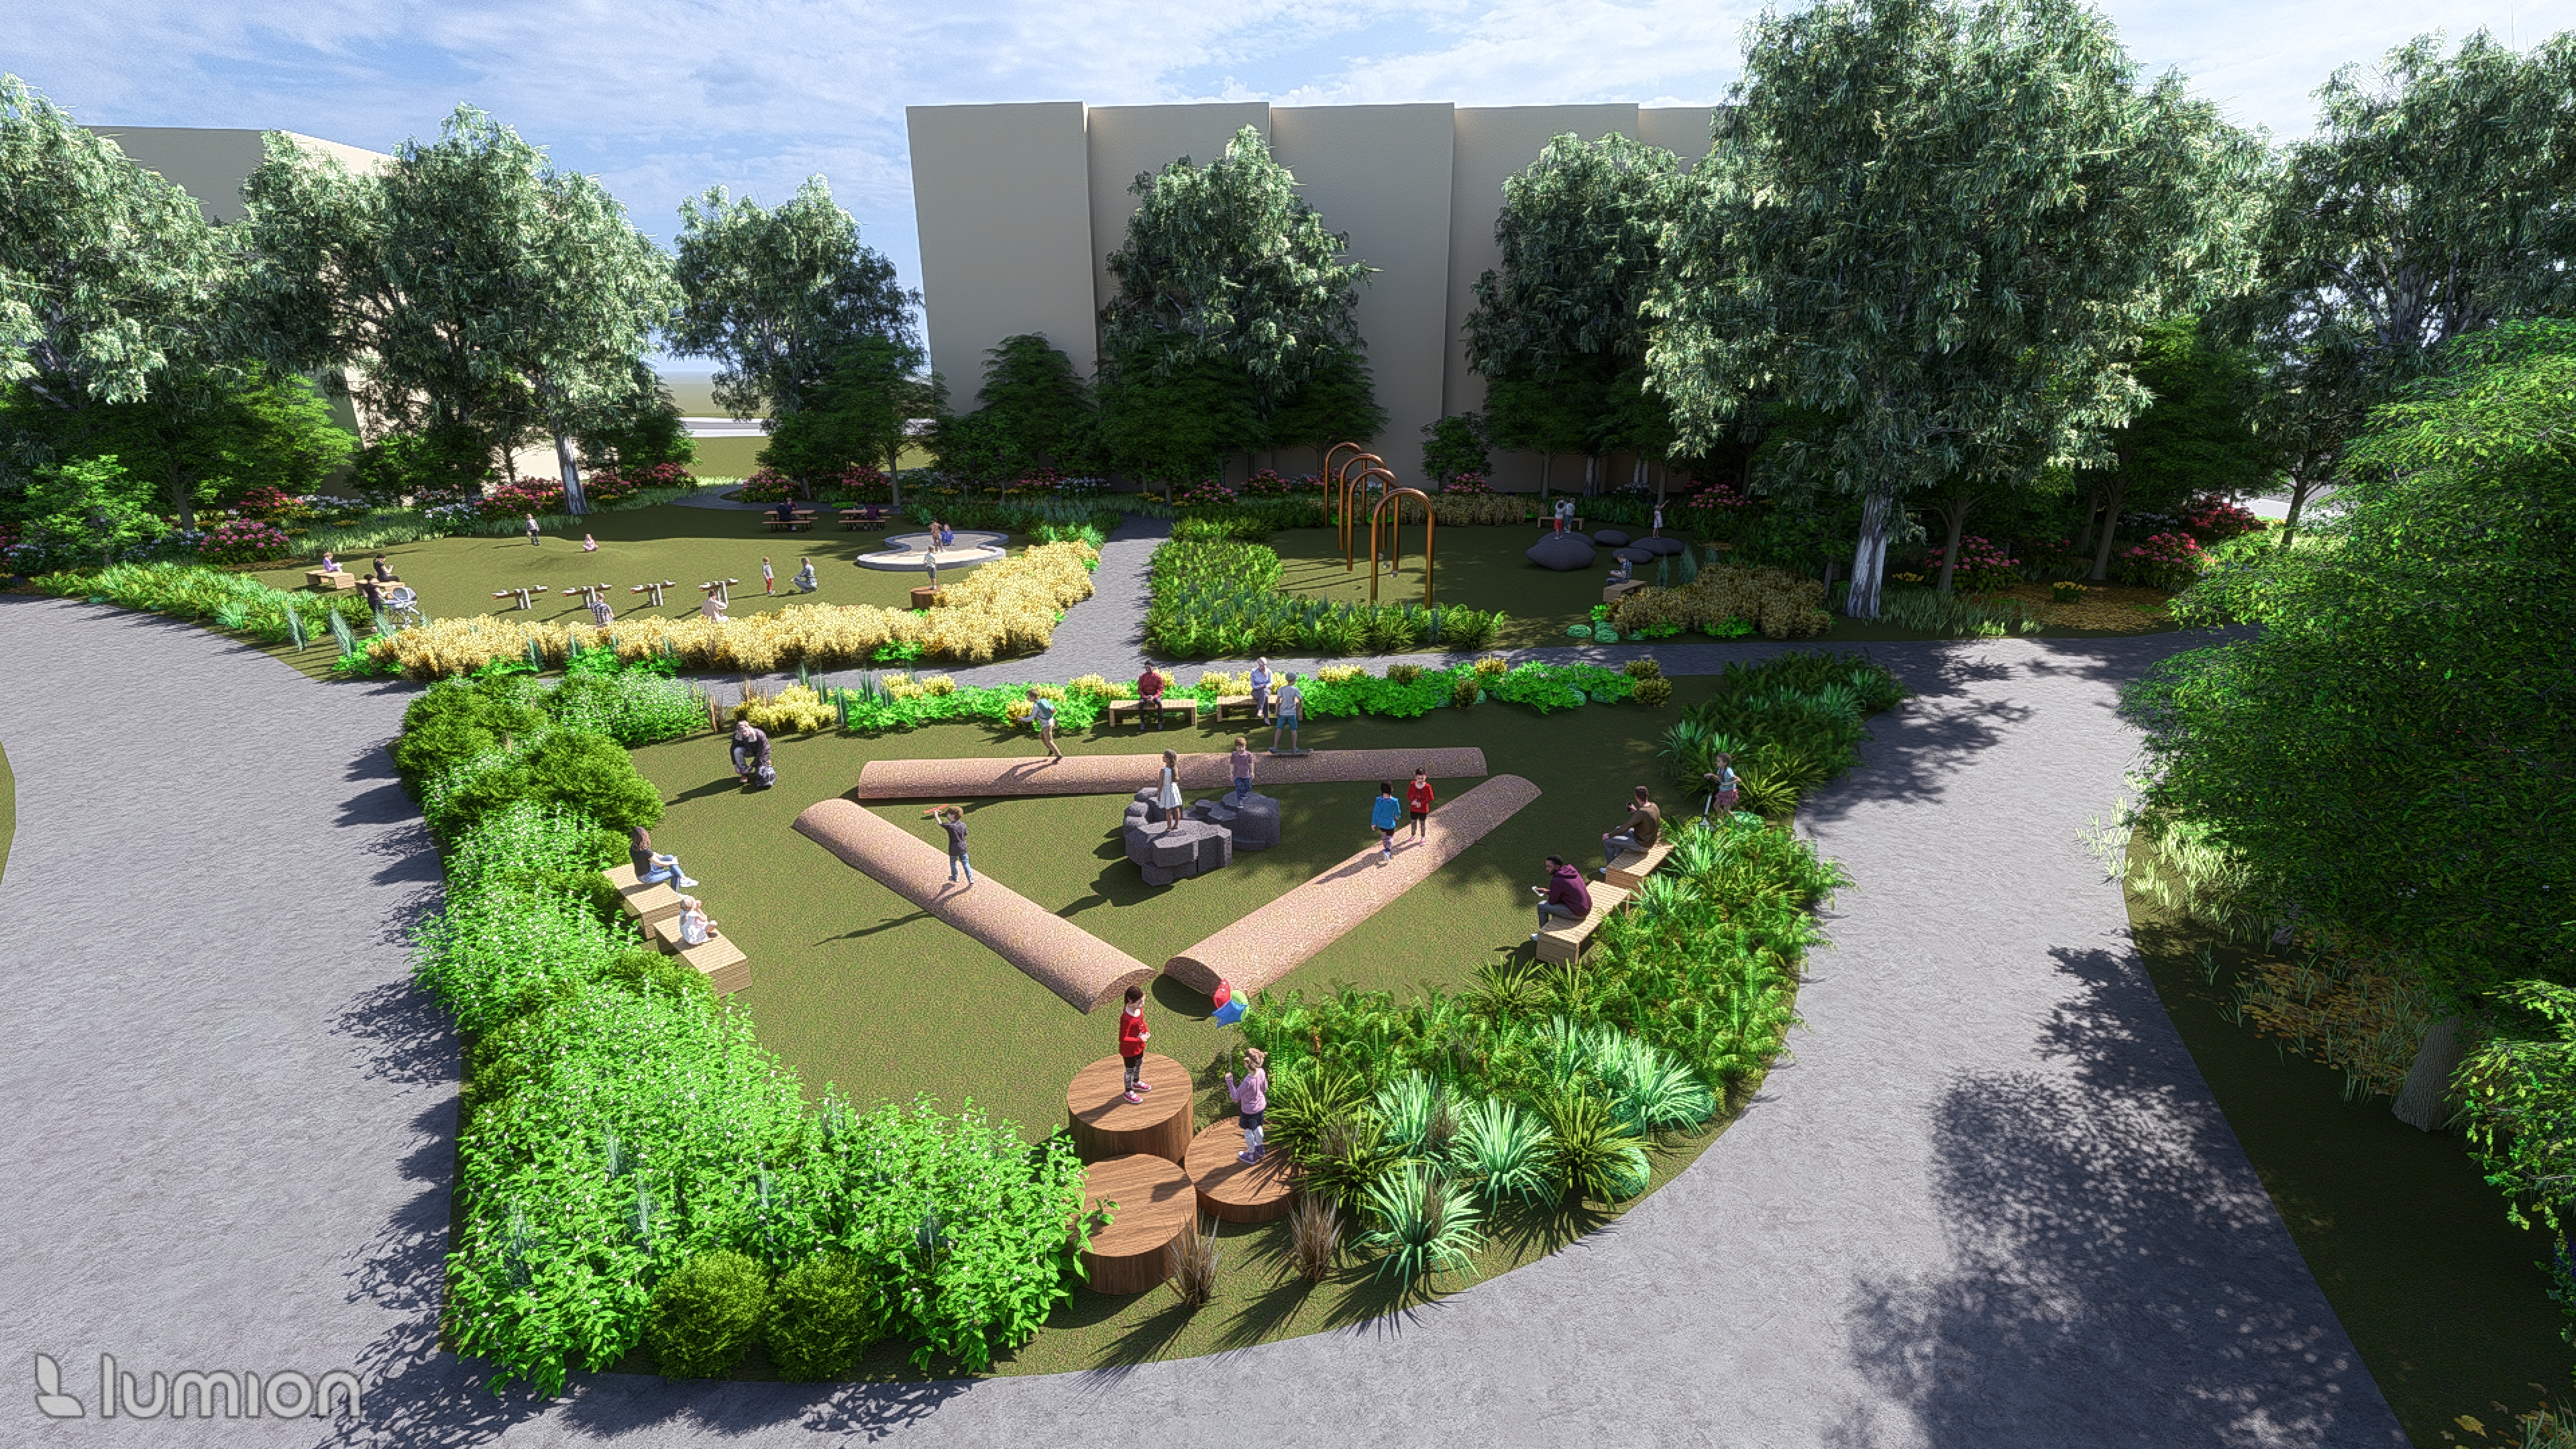
Set in the southwestern pocket beside Sandringham Road, the play area uses timber balance logs, stepping tree rounds, basalt boulders and corten hoops so children climb and explore at the neighbourhood's front door.
drawn in from the main street
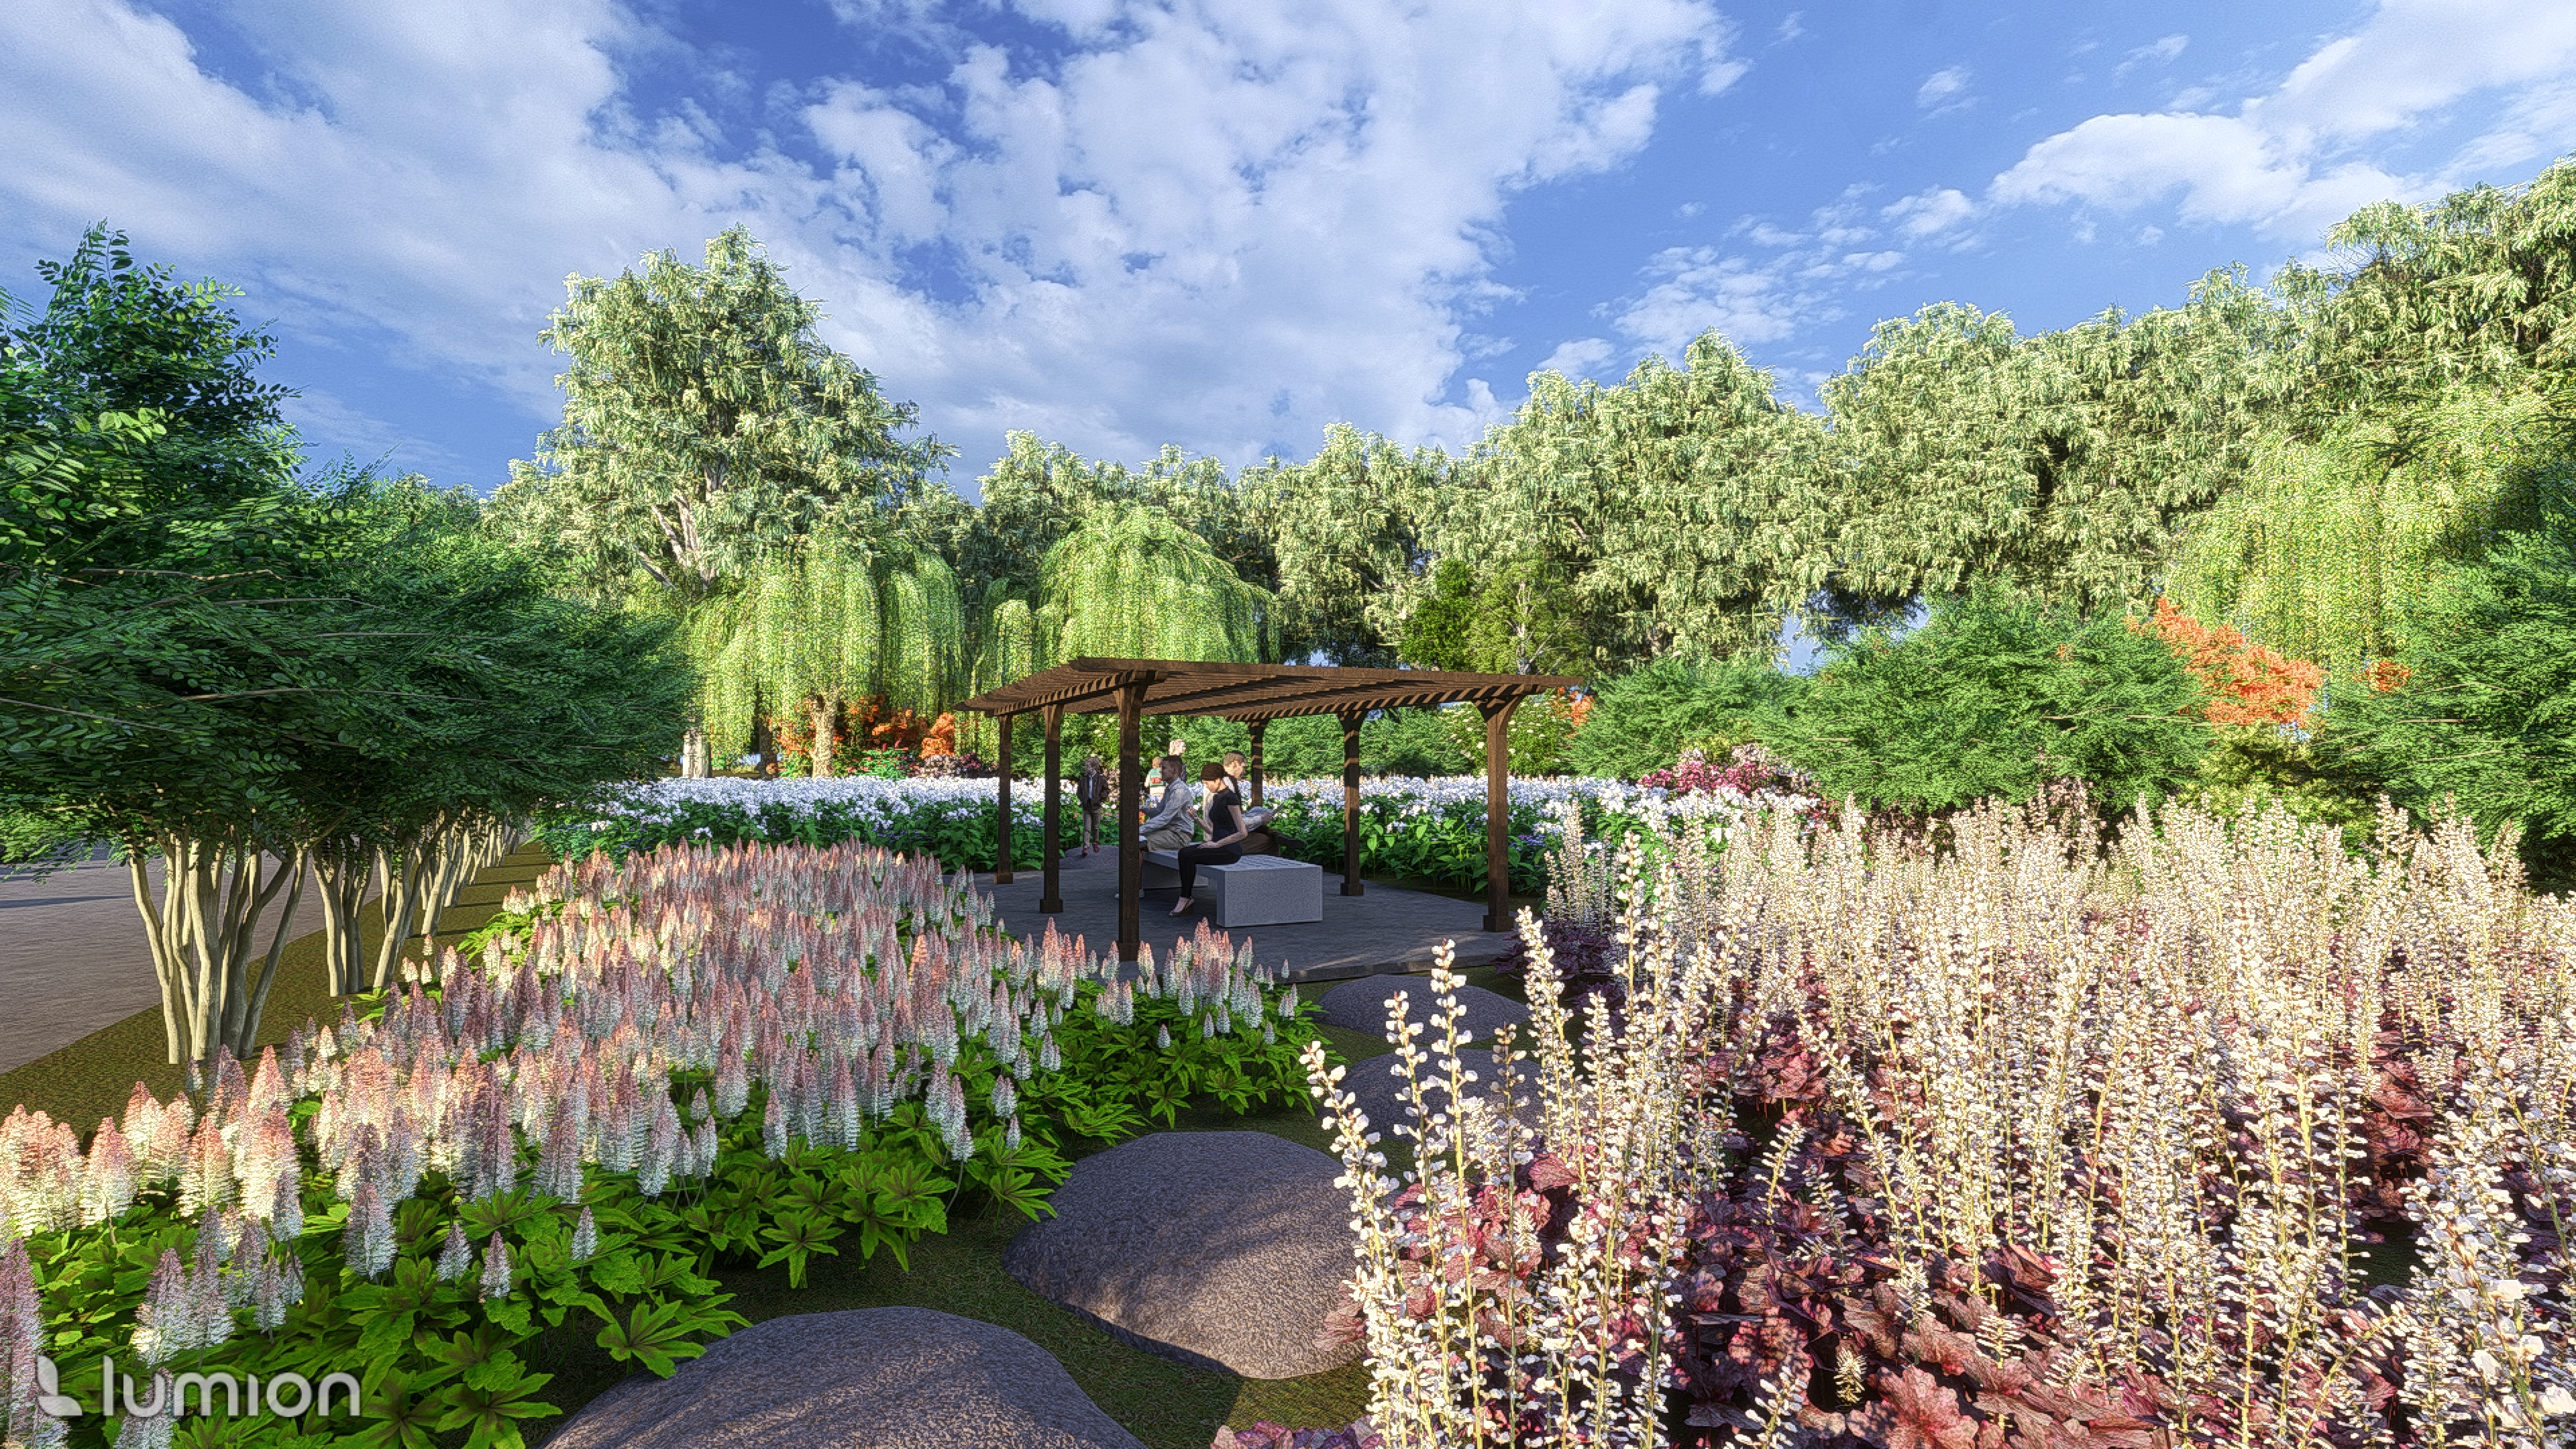
Tucked between the meadow and the northern walk, the Zen garden offers a calm pocket away from the arterial road. Basalt stepping stones lead through tall flowering perennials to a shaded timber pergola.
stillness beside the water
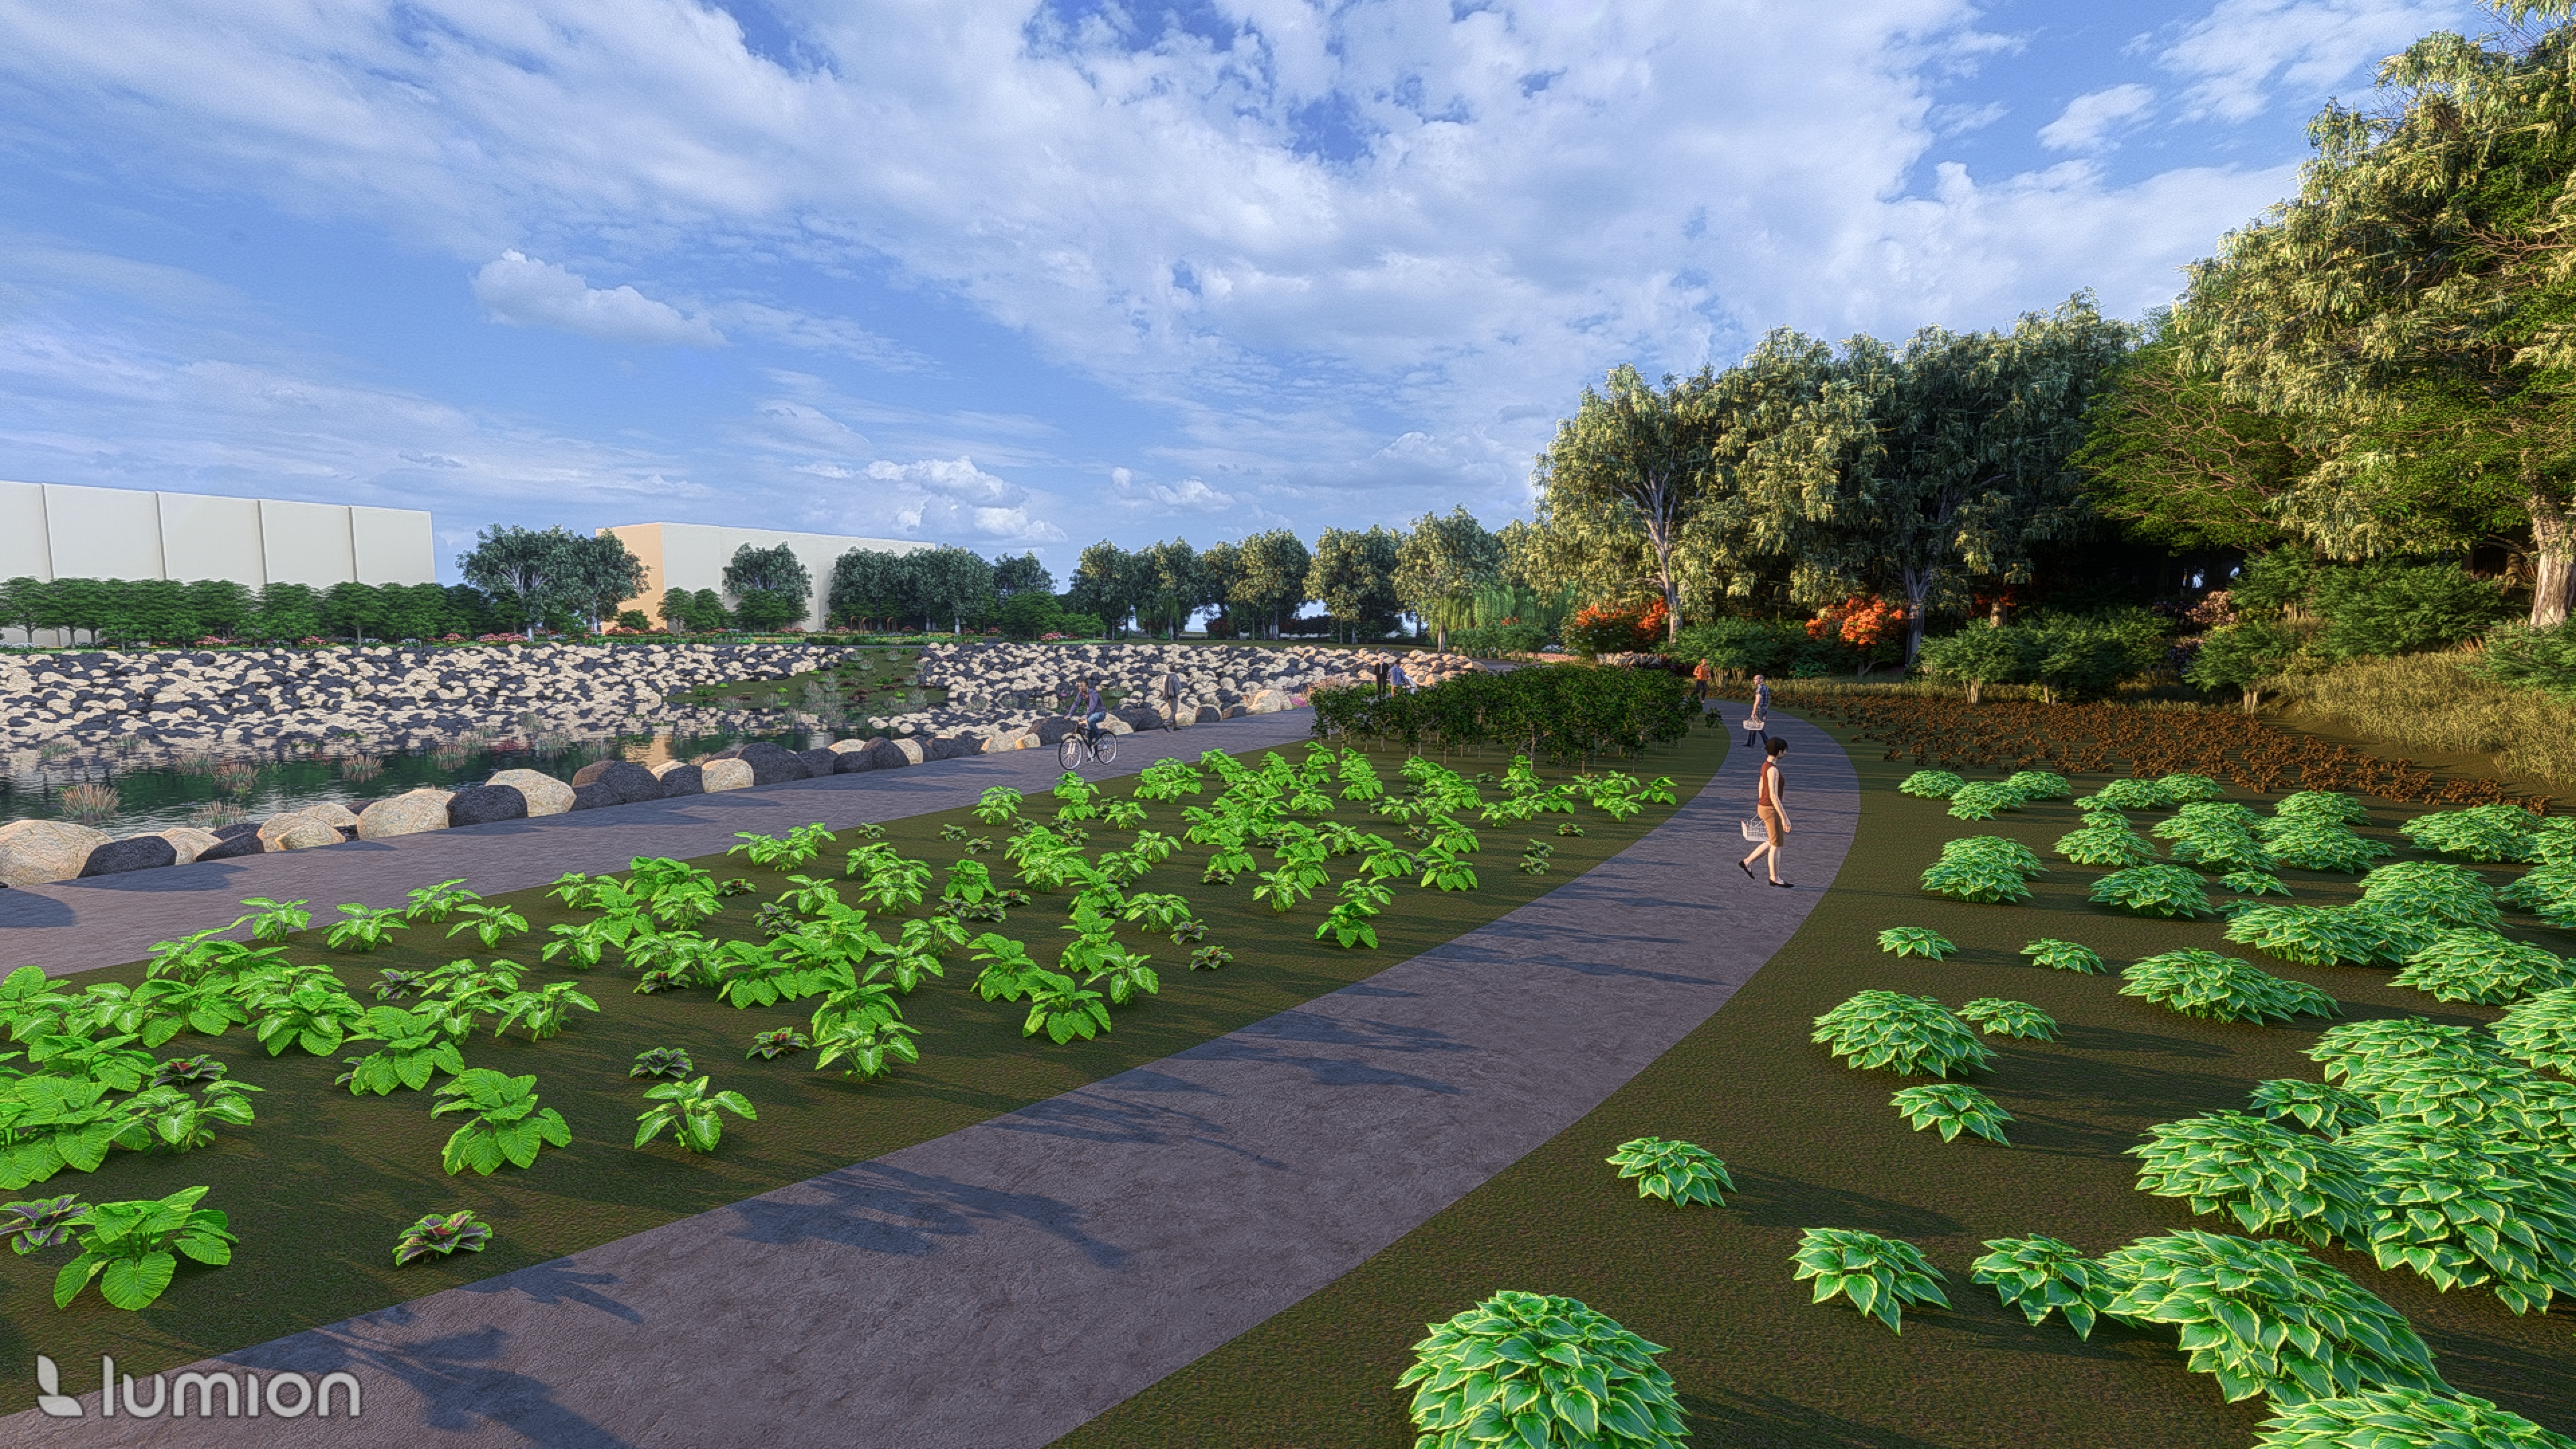
Along the sun-facing northern edge, sweeping paths weave between community garden beds and regenerative forest planting, looking straight out across the basalt rock bands in the retention pond.
shared ground above the basin
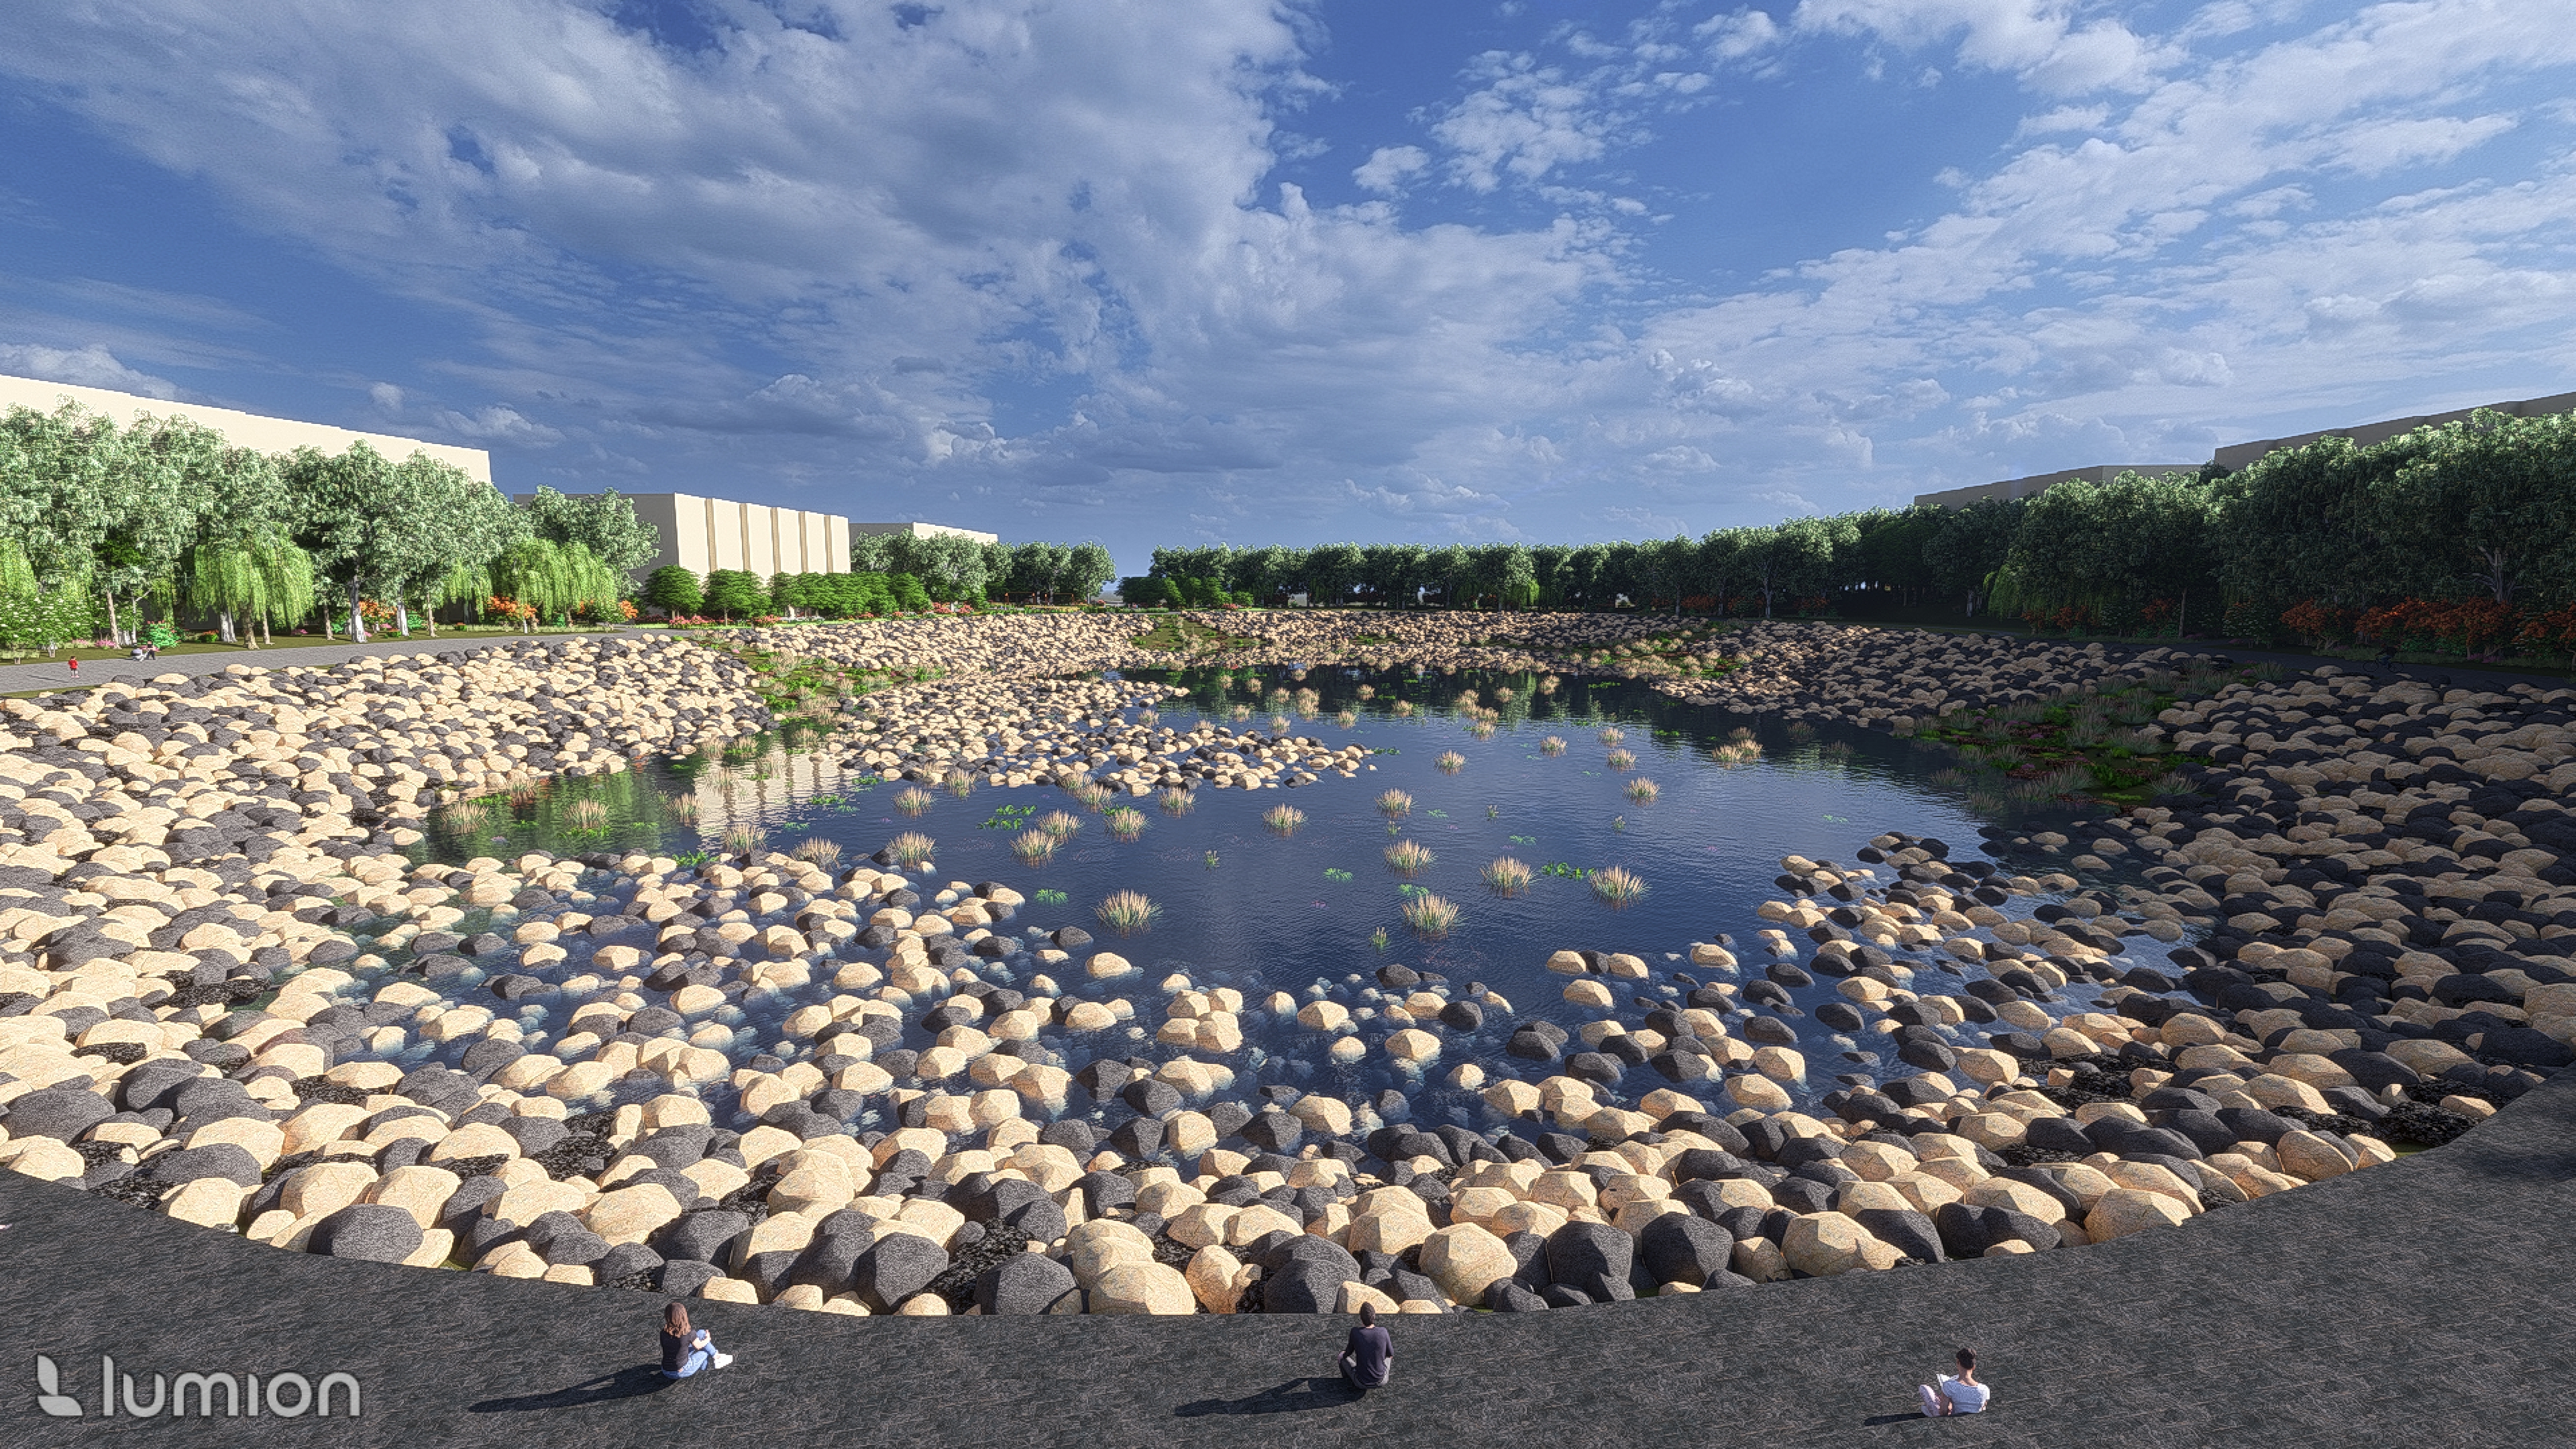
At the eastern end of the 250-metre oval, terraced seating steps down to the water where visitors arriving from the eastern detention basin can sit and take in the full sweep of the wetland and its volcanic rock waves.
where the grandstands once stood
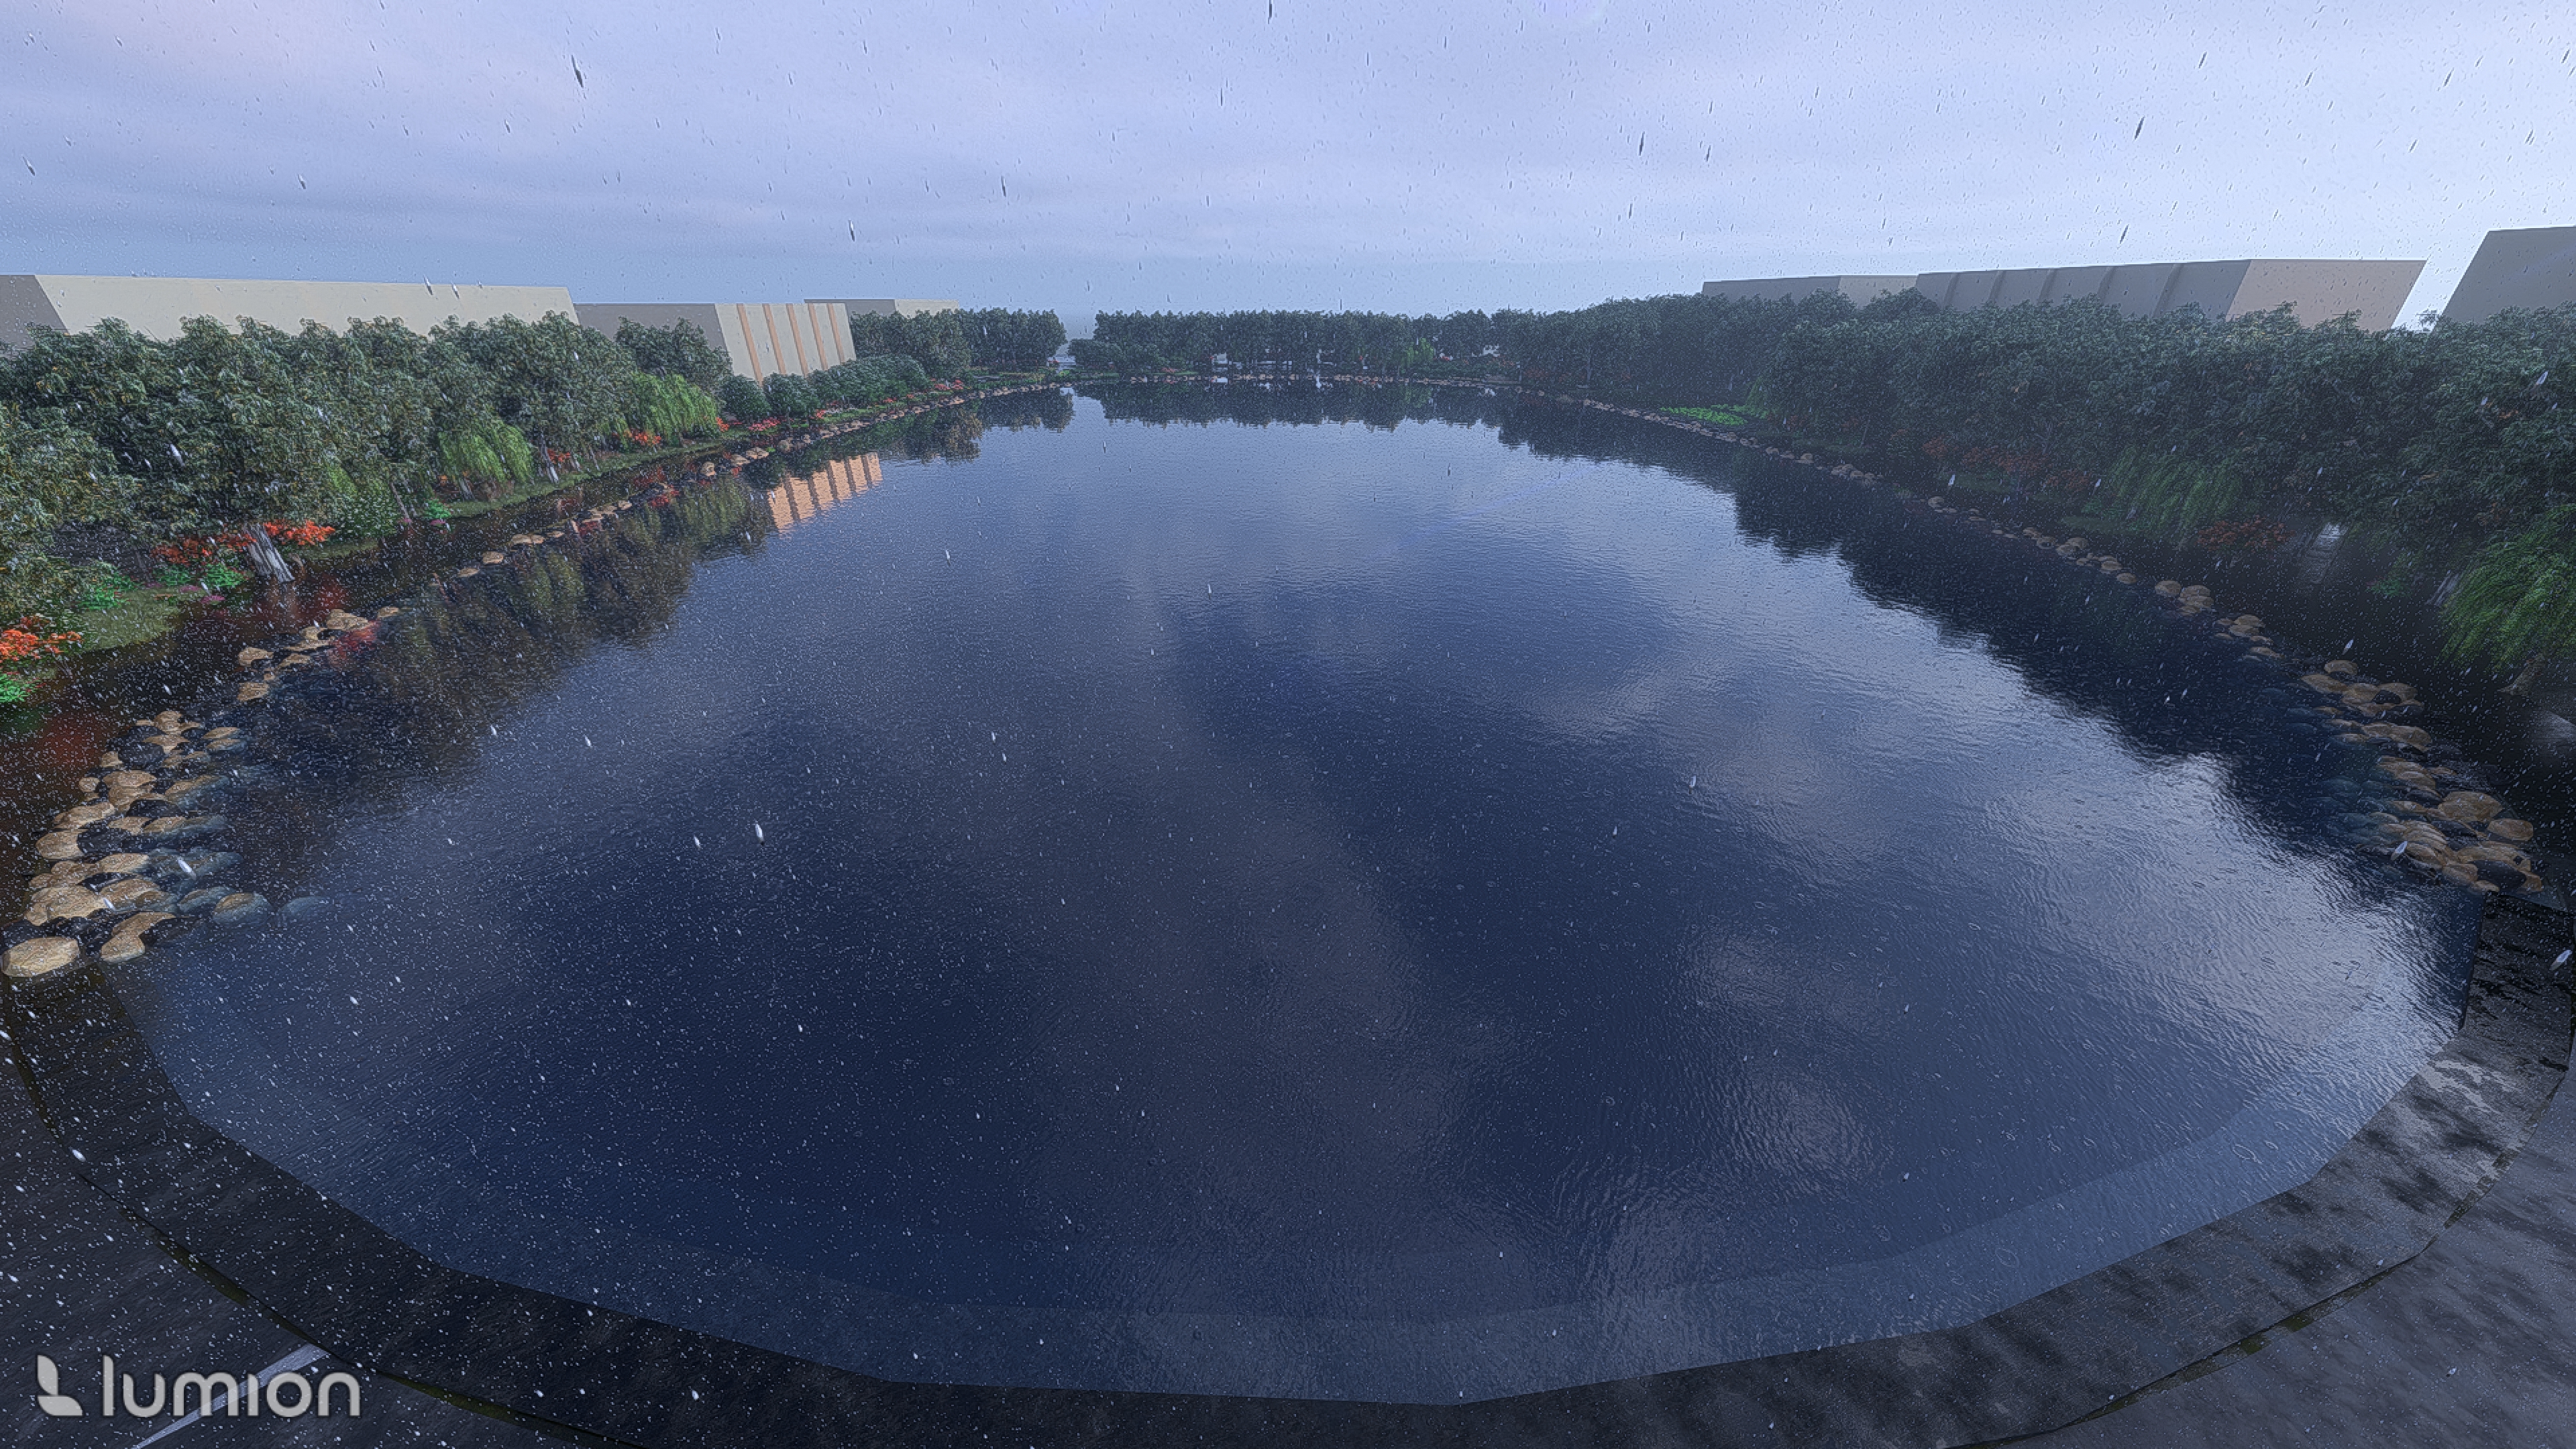
When extreme rain hits the catchment, the volcanic rock waves submerge and the 250 by 150 metre oval fills right to the upper terrace rim, holding 137,130 cubic metres of stormwater to keep the surrounding homes and streets safe.
the basin doing its job
From catchment-wide GIS overlays down to the basalt boulders on the stadium floor, the project shows how an urban flood basin can hold both stormwater and local identity.
- The basin
Work with gravity
Eden Park sits at the bottom of a 26-metre drop from the northern and eastern ridges. Turning the lowest ground into a 137,130 cubic metre retention pond turns the suburb's biggest flood risk into its centrepiece park.
- Two paths
Bold spine or protective clusters
Testing the Radical green spine against the Conservative wetland pockets shows that flood adaptation can either reshape the valley floor with new apartment density or stitch localized water storage into existing heritage streets.
- The oval
Keep the memory of the game
Holding onto the 250 by 150 metre elliptical geometry honours a century of rugby and cricket at Eden Park, while native grass-like wetland plants carry the memory of the stadium turf through rising and falling water.
- The ground
Anchor the design in volcanic history
Wavy basalt boulders trace the lava flows of Three Kings, Mount Eden and Mount Albert across the pond floor, inviting people to the water's edge on dry days and slowing runoff when storms arrive.
Ask me anything about this project.
living with water in a 1930s Italian foundation town
Once an ancient Roman marsh, the Agro Pontino was drained in the 1930s and laid out as a modernist agricultural grid. Today Pontinia sits almost at sea level between the Lepini mountains and the engineered River Sisto, where mountain runoff and river overflow meet flat, water-holding clay and peat soils. This project pairs Room-for-the-River ecological restoration with city-scale streets, parks and building retrofits so farming, community life and seasonal floodwater can share the plain.
Hover over the five site analysis postcards below to read how topography, mountain runoff, soils and land use shape flood risk in Pontinia, followed directly by the flood adaptation masterplan.
Mountain runoff meets river overflow.
Surface runoff from the Lepini mountains in the background gathers across the low-lying plain. Via Appia acts as a sharp border where pluvial mountain flooding ends, while the land from Via Appia to River Sisto floods when the engineered river and canals overflow.
- Pluvial flooding (east of Via Appia)
- Fluvial overflow (Via Appia to River Sisto)
- Major buildings
two flood forces on one plain
- Widened river & canal (cyan)
- 15 m riparian buffer & southern basin
- Detention pond parks & rain gardens
- Overland drainage streets (4 profiles)
- Pedestrian streets & heritage core
- 9 emergency rooftop shelters
The Pontinia flood adaptation masterplan.
Inspired by the Dutch Room for the Waal in Nijmegen and the Chesapeake Bay Riparian Buffer Network, River Sisto and the town canal are widened in cyan and wrapped in 15-metre native riparian sponge buffers, feeding a new multipurpose water retention basin south of the river. Inside the flat town grid, four overland drainage road profiles channel heavy rainfall down the middle of the street into re-graded detention pond parks and pedestrian rain-garden corridors around the central piazza. Along the riverbanks and town centre, staged building retrofits, deployable heritage flood barriers and nine emergency rooftop shelters on schools, warehouses and shops keep residents safe in place.
sponge banks outside, drainage streets and safe rooftops inside
Once home to Volsci agrarian communities, the Pontine marshes defied drainage attempts by Julius Caesar, Emperor Trajan and Theodoric before Mussolini's 1930s reclamation canals cut across the plain. Today, climate change regularly pushes Canal Botte over its banks into eastern Pontinia. The site design responds by storing overflow in a chain of upstream wetlands before it reaches the lower catchment.
Canal Botte spilling into town
During heavy rain, muddy water in Canal Botte spills straight into the adjacent parks, streets and low-lying properties along the eastern edge of Pontinia, with the Lepini mountains in the background.
when the engineered canal overflows
Homes and farmland under water
Because Pontinia sits almost at sea level on water-holding clay soil, overflow from Canal Botte lingers across residential blocks and surrounding agricultural plots.
nearly at sea level
- Controlled flood-storage wetlands & widened canal
- Raised central wetland islands
- Outer protective embankment & dike line
Five upstream retention wetlands
Concrete linings are removed and Canal Botte is widened and deepened, feeding five controlled flood-storage wetlands upstream of the town. Raised central islands offer ecological and recreational sanctuary, while 3.5 to 5 metre outer embankments keep floodwater out of neighbouring farms. The southernmost wetland connects directly to Pontinia via Via Migliara 47, Via dei Volsci and Via Verdi.
catch the water before it reaches town
At the intersection of Via Migliara 47 and Via dei Volsci, the wetland closest to Pontinia becomes a 10-hectare northeast pocket park (310 by 360 metres, 3.5 metres deep). Five curving paths cross the water to a 0.4-hectare central island (90 by 80 metres) raised one metre above the surrounding plain.
The 10-hectare wetland basin
Fed by the widened and naturalised Canal Botte, the 3.5-metre-deep wetland purifies stormwater, recharges the groundwater table and creates habitat for birds, fish and insects. Outer embankments rising 3.5 to 5 metres protect surrounding homes, while an eastern viewing bay frames views toward the Mount Lepini ranges.
310 × 360 m basin · 3.5 m deep
Play area and Mediterranean food garden
Lifted one metre higher than the surrounding land, the 90 by 80 metre island pairs a natural timber play area with a community garden growing Mediterranean crops used in Italian cuisine. Flood-tolerant perimeter trees and locally sourced benches give parents shaded places to sit while children play.
0.4 ha island · +1 m elevation
From the town edge to the viewing bay
Cutting across the town street and naturalised Canal Botte through the outer protective embankment, the 3.5-metre-deep planted wetland marsh, the raised central island and the eastern viewing bay looking toward the Mount Lepini ranges.
embankment, marsh and raised island
Across the embankments and island rooms
Showing how the 3.5 to 5 metre outer embankments contain peak floodwaters on both sides while the elevated central island holds the playground, Mediterranean community garden and shade canopy safely above the water table.
3.5 to 5 m protective dikes
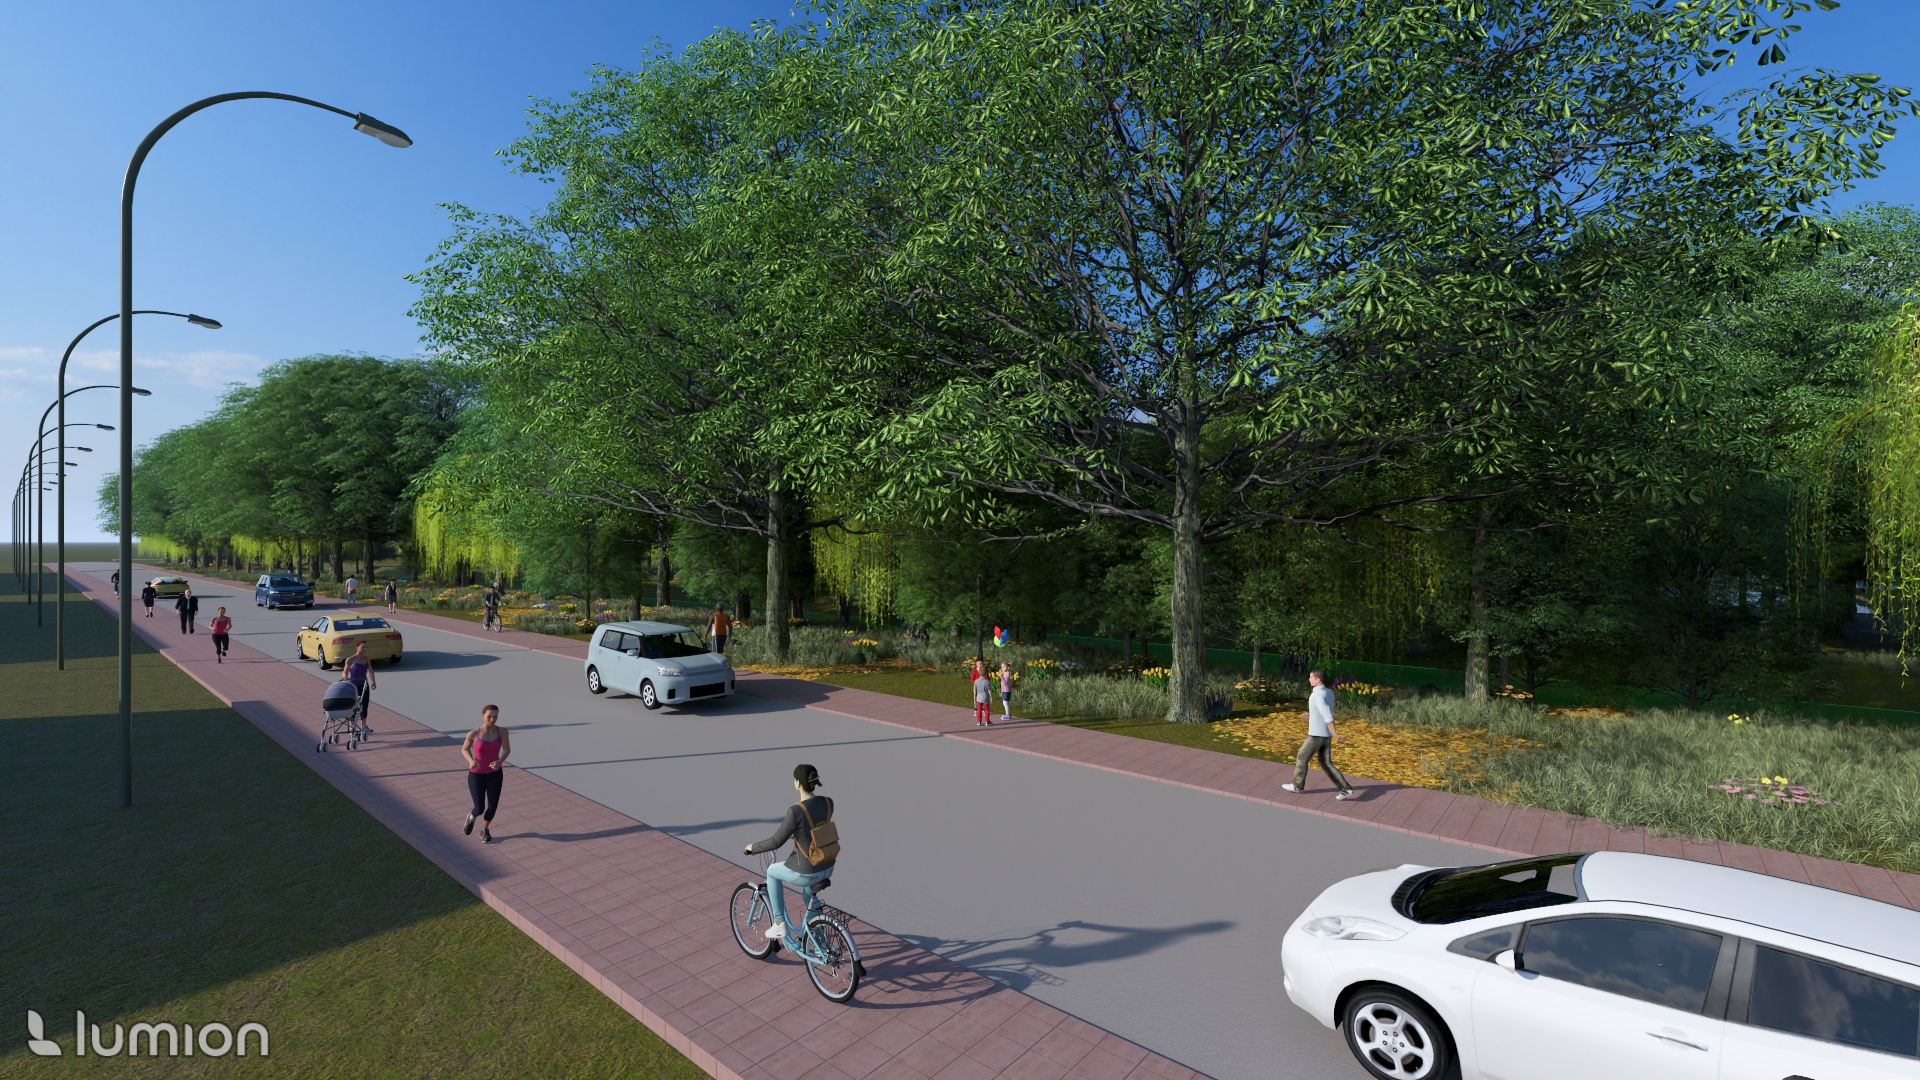
Three access points along Via Migliara 47, Via dei Volsci and Via Verdi connect the town centre and nearby shops straight to the wetland. Wide, gentle pathways welcome cyclists, wheelchairs and families beneath a cool tree canopy.
stitching the town to the wetland
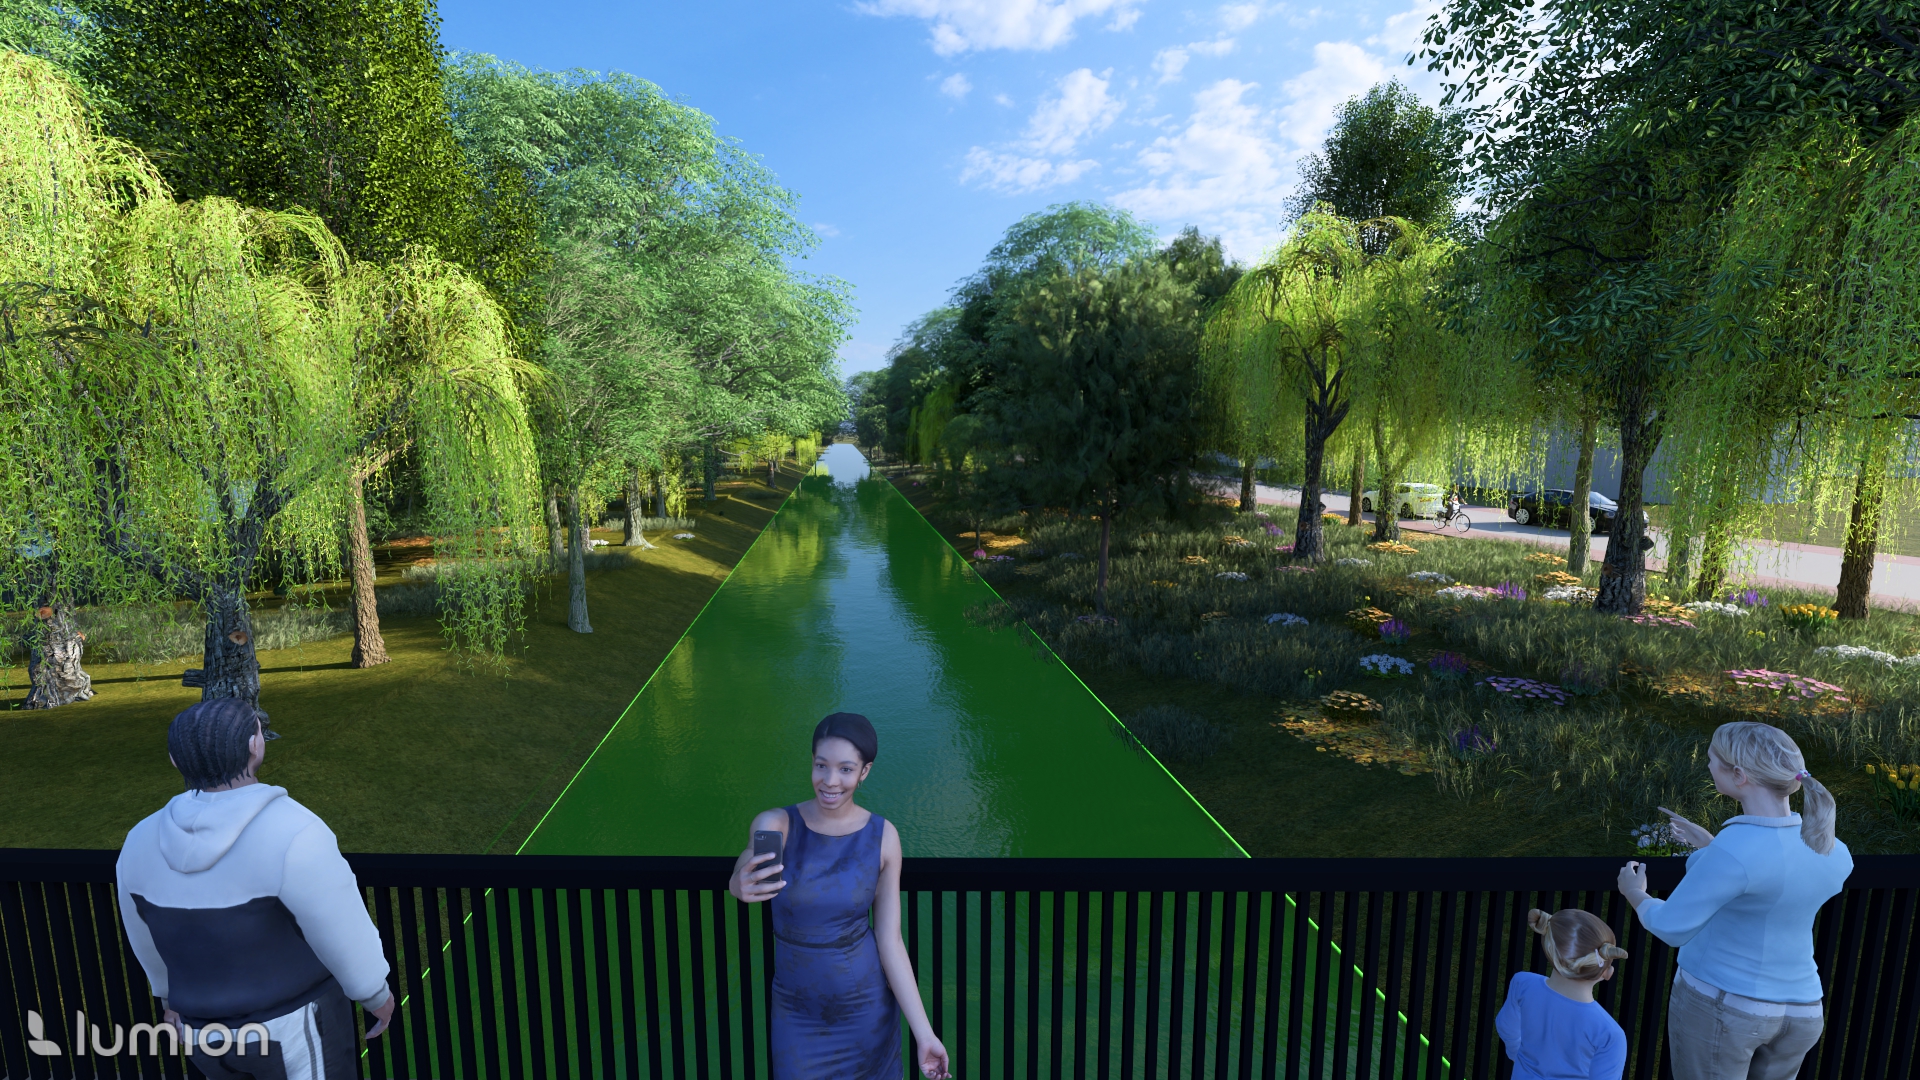
Removing the rigid concrete channel lets Canal Botte breathe. Widened and deepened banks planted with weeping willows and wildflower meadows slow the current, filter runoff and turn an engineered drain into a living corridor.
from concrete drain to living river
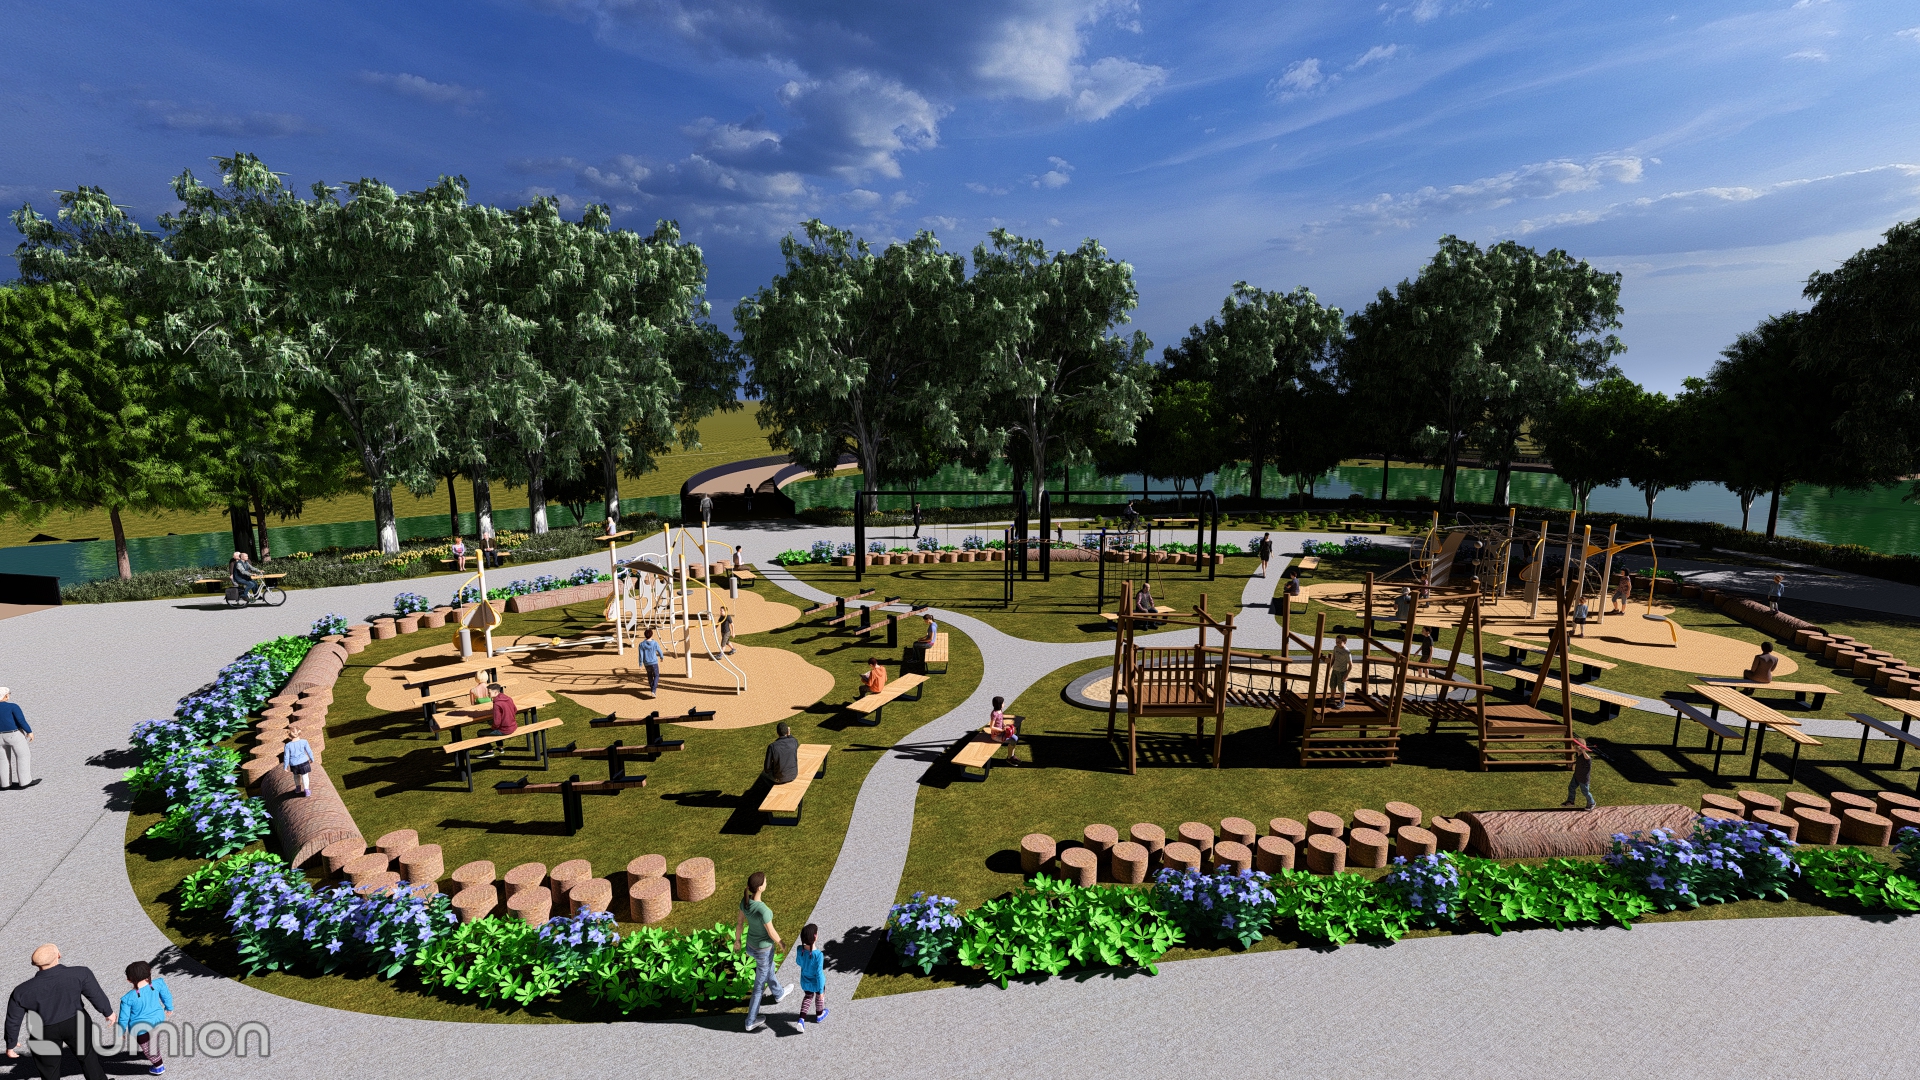
Built from locally sourced timber logs, stepping stumps and climbing frames, the island play area gives Pontinia's children a place to explore surrounded by water, perimeter benches and damp-tolerant shade trees.
locally sourced timber and stone
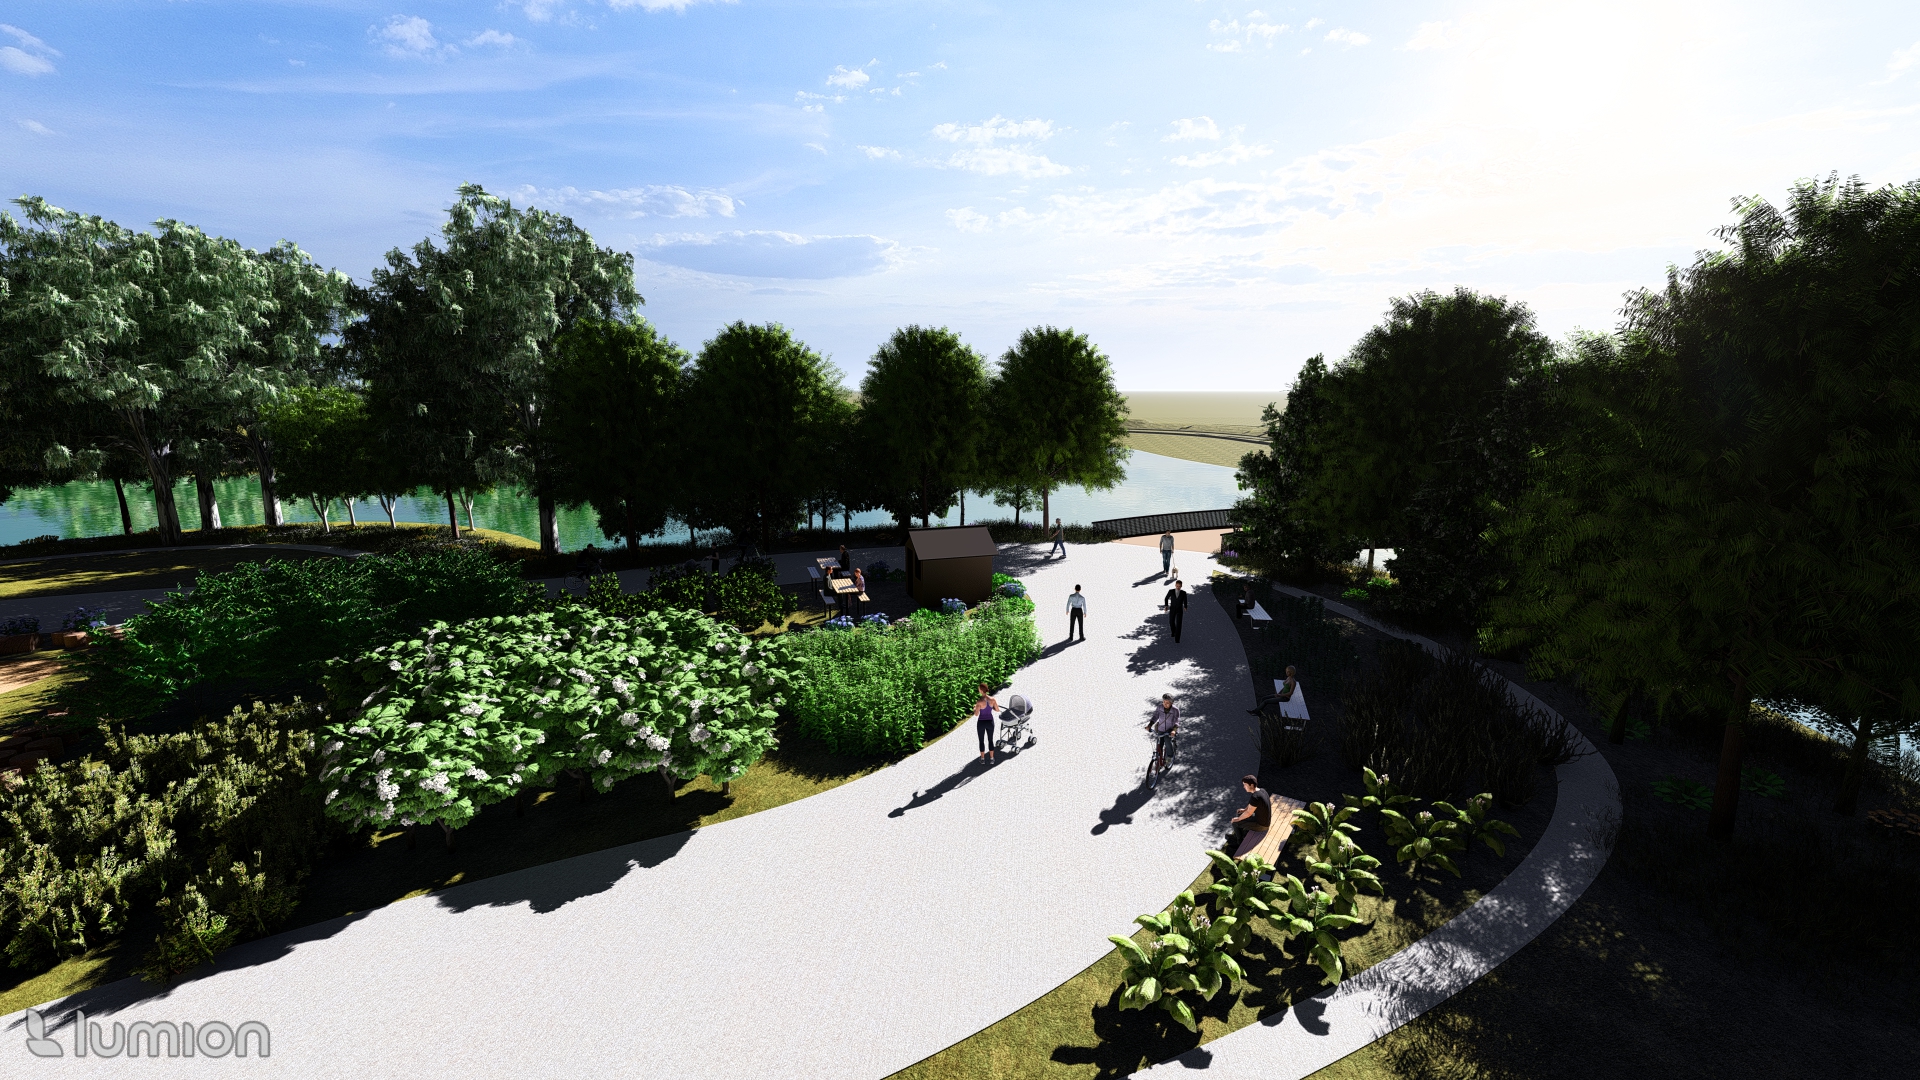
Raised one metre above the surrounding land, the 0.4-hectare island stays comfortable and shaded. Its community gardens grow Mediterranean produce for local Italian kitchens, emergency food reserves and charity markets.
food security and shaded rest
Across the Pontine Plain and along the banks of Canal Botte, the project shows how a 1930s agricultural foundation town can make peace with the water it was built upon.
- Upstream
Store overflow before it reaches town
Widening Canal Botte and stringing five controlled wetland basins upstream catches floodwater high in the system, while 3.5 to 5 metre outer embankments protect neighbouring farms and streets.
- Ten hectares
Turn the northeast edge into a civic wetland
At Via Migliara 47 and Via dei Volsci, a 3.5-metre-deep pocket park purifies stormwater, recharges groundwater and opens a viewing bay toward the Mount Lepini ranges.
- The island
One metre of elevation creates a dry sanctuary
Lifting the 0.4-hectare central island a metre above the plain gives children a locally crafted playground and residents a Mediterranean food garden surrounded by water.
- Agro Pontino
Balance 1930s geometry with marsh ecology
Pairing town-wide drainage streets and emergency rooftops with naturalised canals and wetland islands restores ecological richness and social life to the Pontine Plain.
Ask me anything about this project.
Thank you for taking the time to look through my work.
My path into urban planning began with landscape architecture, and that design background continues to shape how I think about cities and the places we live in. I'm now looking forward to putting my planning knowledge into practice and learning from the people I work alongside.
If my work resonates with you, or you'd simply like to have a conversation about planning and design, I'd be glad to hear from you.
Jyoti Prakash